|
Download Data (XLS File) |
|
||||||||
|
||||||||
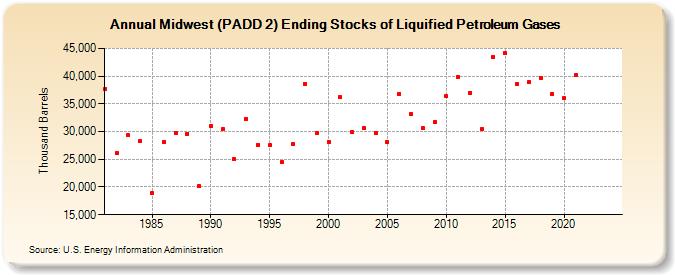
| Midwest (PADD 2) Ending Stocks of Liquified Petroleum Gases (Thousand Barrels) | ||||||||
| Decade | Year-0 | Year-1 | Year-2 | Year-3 | Year-4 | Year-5 | Year-6 | Year-7 | Year-8 | Year-9 |
|---|---|---|---|---|---|---|---|---|---|---|
| 1980's | 37,728 | 26,042 | 29,295 | 28,227 | 18,889 | 28,078 | 29,741 | 29,610 | 20,127 | |
| 1990's | 31,011 | 30,427 | 25,012 | 32,337 | 27,631 | 27,497 | 24,488 | 27,745 | 38,660 | 29,809 |
| 2000's | 28,143 | 36,245 | 29,848 | 30,576 | 29,669 | 28,105 | 36,847 | 33,095 | 30,594 | 31,711 |
| 2010's | 36,331 | 39,904 | 37,007 | 30,488 | 43,404 | 44,079 | 38,642 | 38,904 | 39,679 | 36,792 |
| 2020's | 35,980 | 40,136 | -- | -- |
| - = No Data Reported; -- = Not Applicable; NA = Not Available; W = Withheld to avoid disclosure of individual company data. |
| Release Date: 6/28/2024 |
| Next Release Date: 8/30/2024 |