|
Download Data (XLS File) |
|
||||||||
|
||||||||
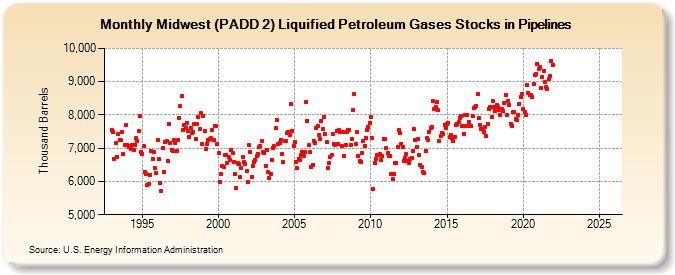
| Midwest (PADD 2) Liquified Petroleum Gases Stocks in Pipelines (Thousand Barrels) | ||||||||
| Year | Jan | Feb | Mar | Apr | May | Jun | Jul | Aug | Sep | Oct | Nov | Dec |
|---|---|---|---|---|---|---|---|---|---|---|---|---|
| 1993 | 7,548 | 7,497 | 6,667 | 7,143 | 6,737 | 7,413 | 7,258 | 7,236 | 7,476 | 6,839 | 7,084 | 7,682 |
| 1994 | 7,095 | 7,037 | 7,059 | 6,974 | 7,110 | 6,941 | 7,108 | 7,305 | 7,216 | 7,519 | 7,976 | 6,891 |
| 1995 | 6,838 | 7,051 | 6,291 | 6,234 | 5,898 | 5,932 | 6,204 | 6,920 | 6,665 | 6,898 | 6,392 | 6,249 |
| 1996 | 7,244 | 6,667 | 5,958 | 5,700 | 7,005 | 6,297 | 7,176 | 7,209 | 6,624 | 7,715 | 7,145 | 6,948 |
| 1997 | 6,909 | 7,249 | 7,169 | 6,905 | 7,238 | 7,910 | 8,260 | 8,571 | 7,535 | 7,694 | 7,615 | 7,764 |
| 1998 | 7,526 | 7,351 | 7,617 | 7,446 | 7,482 | 7,739 | 7,284 | 7,732 | 7,938 | 7,575 | 8,063 | 7,138 |
| 1999 | 7,981 | 7,525 | 6,964 | 7,124 | 7,232 | 7,278 | 7,296 | 7,553 | 7,242 | 7,666 | 7,654 | 7,126 |
| 2000 | 6,845 | 5,992 | 6,221 | 6,472 | 6,429 | 6,810 | 6,791 | 6,555 | 6,720 | 6,654 | 6,957 | 6,852 |
| 2001 | 6,572 | 6,222 | 5,815 | 6,553 | 6,513 | 6,124 | 6,400 | 6,731 | 6,577 | 6,533 | 6,310 | 5,971 |
| 2002 | 7,089 | 6,881 | 6,138 | 6,479 | 6,574 | 6,643 | 6,765 | 6,840 | 7,045 | 7,062 | 7,207 | 6,894 |
| 2003 | 6,846 | 6,463 | 6,937 | 6,282 | 6,101 | 6,228 | 6,658 | 6,996 | 7,054 | 7,599 | 7,834 | 7,127 |
| 2004 | 7,166 | 7,239 | 6,827 | 6,580 | 7,228 | 7,214 | 7,447 | 7,497 | 7,408 | 8,321 | 7,526 | 7,073 |
| 2005 | 7,186 | 6,592 | 6,391 | 6,687 | 6,636 | 6,782 | 6,897 | 6,775 | 6,895 | 8,403 | 7,829 | 7,085 |
| 2006 | 6,889 | 6,428 | 6,508 | 7,227 | 7,155 | 7,610 | 7,662 | 7,398 | 7,287 | 7,822 | 7,577 | 7,931 |
| 2007 | 7,432 | 7,189 | 6,396 | 6,557 | 6,748 | 6,783 | 7,430 | 7,124 | 7,104 | 7,517 | 7,135 | 7,533 |
| 2008 | 7,484 | 7,055 | 7,483 | 6,760 | 7,107 | 7,493 | 7,550 | 7,549 | 7,109 | 7,271 | 8,149 | 8,618 |
| 2009 | 7,115 | 7,473 | 6,767 | 6,602 | 6,597 | 6,857 | 7,231 | 7,057 | 7,314 | 7,557 | 7,627 | 7,758 |
| 2010 | 7,929 | 7,298 | 5,764 | 6,545 | 6,674 | 6,805 | 6,796 | 6,819 | 6,652 | 6,765 | 7,266 | 7,273 |
| 2011 | 6,999 | 6,855 | 6,780 | 6,752 | 6,218 | 6,060 | 6,212 | 6,552 | 6,559 | 7,046 | 7,545 | 7,446 |
| 2012 | 7,140 | 7,023 | 6,624 | 6,711 | 6,824 | 6,605 | 6,563 | 6,683 | 6,701 | 6,906 | 7,586 | 7,232 |
| 2013 | 7,031 | 7,290 | 6,792 | 6,493 | 6,424 | 6,280 | 6,256 | 6,923 | 7,300 | 7,240 | 7,488 | 7,597 |
| 2014 | 7,632 | 8,416 | 8,181 | 8,246 | 8,384 | 8,147 | 7,226 | 7,359 | 7,457 | 7,434 | 7,697 | 7,609 |
| 2015 | 7,713 | 7,758 | 7,341 | 7,406 | 7,293 | 7,212 | 7,347 | 7,687 | 7,721 | 7,784 | 7,922 | 7,974 |
| 2016 | 7,661 | 7,440 | 7,990 | 7,673 | 8,010 | 7,792 | 7,666 | 7,654 | 7,973 | 8,199 | 8,226 | 8,271 |
| 2017 | 8,615 | 7,910 | 7,698 | 7,584 | 7,579 | 7,482 | 7,642 | 7,366 | 7,733 | 8,170 | 8,250 | 7,936 |
| 2018 | 8,422 | 8,234 | 8,119 | 8,286 | 8,235 | 8,156 | 8,008 | 8,178 | 8,109 | 8,367 | 8,610 | 7,987 |
| 2019 | 8,406 | 8,292 | 7,741 | 7,663 | 8,073 | 8,091 | 7,876 | 7,842 | 8,008 | 8,337 | 8,525 | 8,633 |
| 2020 | 8,190 | 8,078 | 7,992 | 8,894 | 8,660 | 8,584 | 8,593 | 8,539 | 8,915 | 9,205 | 9,244 | 9,544 |
| 2021 | 9,367 | 9,434 | 8,813 | 9,133 | 9,314 | 8,990 | 8,838 | 8,780 | 9,082 | 9,170 | 9,631 | 9,508 |
| 2022 | -- | -- | -- | -- | -- | -- | -- | -- | -- | -- | -- | -- |
| 2023 | -- | -- | -- | -- | -- | -- | -- | -- | -- | -- | -- | -- |
| 2024 | -- | |||||||||||
| - = No Data Reported; -- = Not Applicable; NA = Not Available; W = Withheld to avoid disclosure of individual company data. |
| Release Date: 3/29/2024 |
| Next Release Date: 4/30/2024 |