|
Download Data (XLS File) |
|
||||||||
|
||||||||
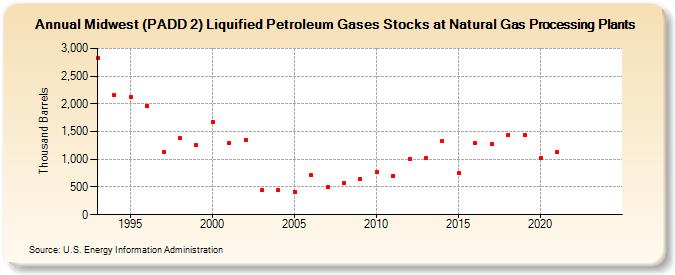
| Midwest (PADD 2) Liquified Petroleum Gases Stocks at Natural Gas Processing Plants (Thousand Barrels) | ||||||||
| Decade | Year-0 | Year-1 | Year-2 | Year-3 | Year-4 | Year-5 | Year-6 | Year-7 | Year-8 | Year-9 |
|---|---|---|---|---|---|---|---|---|---|---|
| 1990's | 2,830 | 2,154 | 2,121 | 1,963 | 1,136 | 1,378 | 1,251 | |||
| 2000's | 1,678 | 1,296 | 1,348 | 441 | 446 | 415 | 709 | 495 | 564 | 645 |
| 2010's | 770 | 706 | 1,013 | 1,022 | 1,324 | 744 | 1,289 | 1,269 | 1,445 | 1,444 |
| 2020's | 1,019 | 1,131 | -- | -- |
| - = No Data Reported; -- = Not Applicable; NA = Not Available; W = Withheld to avoid disclosure of individual company data. |
| Release Date: 3/29/2024 |
| Next Release Date: 8/30/2024 |