|
Download Data (XLS File) |
|
||||||||
|
||||||||
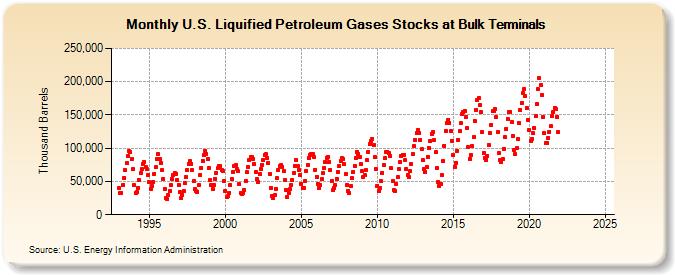
| U.S. Liquified Petroleum Gases Stocks at Bulk Terminals (Thousand Barrels) | ||||||||
| Year | Jan | Feb | Mar | Apr | May | Jun | Jul | Aug | Sep | Oct | Nov | Dec |
|---|---|---|---|---|---|---|---|---|---|---|---|---|
| 1993 | 39,725 | 33,059 | 33,245 | 44,323 | 55,542 | 66,769 | 77,587 | 88,119 | 95,448 | 93,911 | 83,865 | 68,126 |
| 1994 | 44,435 | 33,314 | 33,444 | 40,301 | 51,987 | 62,384 | 68,632 | 75,719 | 78,915 | 71,848 | 67,994 | 59,457 |
| 1995 | 48,591 | 39,039 | 42,783 | 49,437 | 61,898 | 70,987 | 83,777 | 91,429 | 83,232 | 77,491 | 66,807 | 53,825 |
| 1996 | 38,682 | 24,805 | 23,008 | 28,901 | 35,649 | 44,166 | 53,155 | 60,347 | 63,307 | 61,756 | 52,679 | 44,815 |
| 1997 | 33,638 | 24,926 | 29,808 | 35,605 | 47,281 | 56,770 | 67,639 | 76,249 | 80,293 | 76,705 | 67,085 | 49,936 |
| 1998 | 38,423 | 35,204 | 34,579 | 44,182 | 59,878 | 70,888 | 80,699 | 89,222 | 95,987 | 91,577 | 83,445 | 69,789 |
| 1999 | 51,431 | 43,917 | 38,706 | 44,615 | 54,178 | 62,818 | 69,658 | 73,328 | 73,436 | 67,486 | 65,561 | 50,721 |
| 2000 | 35,831 | 26,617 | 27,538 | 32,793 | 44,420 | 53,247 | 64,407 | 72,492 | 74,143 | 68,565 | 64,994 | 46,131 |
| 2001 | 32,701 | 31,126 | 32,914 | 36,911 | 50,946 | 63,677 | 72,113 | 82,047 | 86,526 | 86,567 | 83,963 | 76,133 |
| 2002 | 64,221 | 53,471 | 49,734 | 60,553 | 68,137 | 75,425 | 82,528 | 89,444 | 90,589 | 85,361 | 77,656 | 61,884 |
| 2003 | 40,474 | 27,386 | 25,093 | 29,291 | 39,360 | 54,549 | 67,750 | 72,490 | 74,535 | 71,874 | 65,276 | 52,130 |
| 2004 | 37,592 | 26,793 | 33,271 | 38,517 | 44,770 | 52,374 | 62,776 | 73,342 | 81,740 | 73,054 | 67,947 | 59,817 |
| 2005 | 46,599 | 40,604 | 40,228 | 50,672 | 66,196 | 74,973 | 84,757 | 90,095 | 91,672 | 90,632 | 86,560 | 67,363 |
| 2006 | 57,371 | 46,169 | 40,851 | 44,487 | 53,027 | 62,153 | 70,200 | 79,032 | 85,718 | 87,204 | 79,104 | 67,323 |
| 2007 | 50,376 | 36,597 | 40,348 | 44,657 | 54,323 | 64,630 | 72,497 | 80,902 | 84,830 | 83,439 | 75,495 | 61,274 |
| 2008 | 44,886 | 35,051 | 32,293 | 43,177 | 54,996 | 63,951 | 72,871 | 85,161 | 94,974 | 91,858 | 86,156 | 76,308 |
| 2009 | 65,577 | 57,102 | 59,722 | 66,506 | 81,560 | 94,701 | 105,938 | 111,434 | 114,520 | 105,082 | 86,105 | 68,524 |
| 2010 | 43,615 | 35,811 | 39,786 | 50,988 | 63,225 | 75,048 | 84,787 | 93,547 | 94,681 | 93,313 | 88,588 | 69,792 |
| 2011 | 50,037 | 37,721 | 36,391 | 45,640 | 56,002 | 68,557 | 79,811 | 87,896 | 90,213 | 90,453 | 81,823 | 68,861 |
| 2012 | 59,630 | 56,200 | 65,062 | 76,124 | 90,736 | 102,568 | 112,744 | 122,764 | 127,504 | 122,958 | 112,193 | 98,143 |
| 2013 | 81,803 | 69,438 | 64,845 | 71,949 | 86,485 | 100,649 | 110,622 | 121,956 | 123,777 | 111,781 | 93,531 | 70,840 |
| 2014 | 49,518 | 42,552 | 45,702 | 59,404 | 80,281 | 103,751 | 125,881 | 138,352 | 142,904 | 138,116 | 125,826 | 110,590 |
| 2015 | 89,481 | 71,971 | 78,396 | 95,500 | 112,457 | 125,110 | 137,175 | 151,264 | 154,948 | 155,892 | 147,131 | 129,797 |
| 2016 | 101,073 | 84,345 | 89,164 | 102,907 | 116,733 | 140,515 | 157,192 | 171,883 | 174,781 | 164,896 | 153,843 | 124,550 |
| 2017 | 92,938 | 85,648 | 82,905 | 88,684 | 104,997 | 122,641 | 135,567 | 155,147 | 155,266 | 158,578 | 146,363 | 124,010 |
| 2018 | 92,068 | 82,817 | 78,582 | 83,179 | 99,352 | 116,230 | 129,289 | 143,707 | 154,202 | 154,609 | 138,951 | 118,598 |
| 2019 | 97,976 | 90,691 | 99,739 | 113,449 | 137,773 | 157,481 | 167,828 | 183,187 | 188,677 | 178,422 | 160,866 | 142,748 |
| 2020 | 127,354 | 111,386 | 113,069 | 122,226 | 130,636 | 148,561 | 166,919 | 188,458 | 204,986 | 195,029 | 180,114 | 147,585 |
| 2021 | 122,141 | 107,676 | 108,407 | 115,725 | 124,989 | 132,765 | 148,276 | 154,697 | 160,607 | 159,513 | 147,368 | 123,672 |
| 2022 | -- | -- | -- | -- | -- | -- | -- | -- | -- | -- | -- | -- |
| 2023 | -- | -- | -- | -- | -- | -- | -- | -- | -- | -- | -- | -- |
| 2024 | -- | |||||||||||
| - = No Data Reported; -- = Not Applicable; NA = Not Available; W = Withheld to avoid disclosure of individual company data. |
| Release Date: 3/29/2024 |
| Next Release Date: 4/30/2024 |