|
Download Data (XLS File) |
|
||||||||
|
||||||||
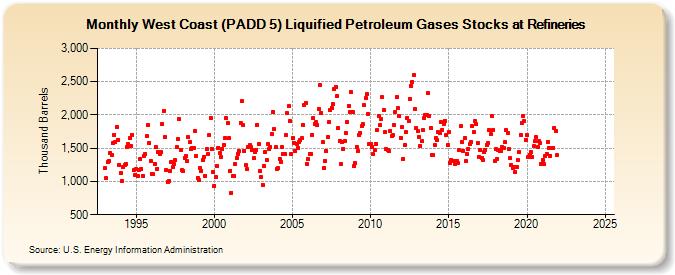
| West Coast (PADD 5) Liquified Petroleum Gases Stocks at Refineries (Thousand Barrels) | ||||||||
| Year | Jan | Feb | Mar | Apr | May | Jun | Jul | Aug | Sep | Oct | Nov | Dec |
|---|---|---|---|---|---|---|---|---|---|---|---|---|
| 1993 | 1,199 | 1,045 | 1,296 | 1,311 | 1,430 | 1,400 | 1,575 | 1,702 | 1,589 | 1,817 | 1,627 | 1,252 |
| 1994 | 1,124 | 1,003 | 1,219 | 1,246 | 1,266 | 1,521 | 1,561 | 1,653 | 1,540 | 1,703 | 1,171 | 1,102 |
| 1995 | 1,190 | 1,084 | 1,169 | 1,339 | 1,190 | 1,088 | 1,385 | 1,413 | 1,682 | 1,845 | 1,581 | 1,311 |
| 1996 | 1,118 | 1,108 | 1,268 | 1,514 | 1,194 | 1,436 | 1,408 | 1,441 | 1,864 | 2,065 | 1,662 | 1,171 |
| 1997 | 998 | 1,000 | 1,159 | 1,299 | 1,217 | 1,259 | 1,319 | 1,517 | 1,639 | 1,936 | 1,466 | 1,167 |
| 1998 | 1,150 | 1,354 | 1,380 | 1,300 | 1,667 | 1,586 | 1,482 | 1,502 | 1,505 | 1,761 | 1,377 | 1,049 |
| 1999 | 1,017 | 1,207 | 1,161 | 1,324 | 1,373 | 1,088 | 1,485 | 1,410 | 1,694 | 1,953 | 1,492 | 1,135 |
| 2000 | 936 | 1,069 | 1,229 | 1,503 | 1,422 | 1,367 | 1,493 | 1,545 | 1,648 | 1,949 | 1,875 | 1,650 |
| 2001 | 1,163 | 832 | 1,083 | 1,085 | 1,262 | 1,352 | 1,419 | 1,454 | 1,879 | 2,204 | 1,842 | 1,462 |
| 2002 | 1,247 | 1,185 | 1,522 | 1,545 | 1,514 | 1,474 | 1,351 | 1,436 | 1,480 | 1,851 | 1,565 | 1,153 |
| 2003 | 1,063 | 949 | 1,229 | 1,436 | 1,315 | 1,562 | 1,490 | 1,518 | 1,719 | 2,049 | 1,785 | 1,512 |
| 2004 | 1,191 | 1,198 | 1,338 | 1,297 | 1,512 | 1,420 | 1,420 | 1,698 | 2,024 | 2,129 | 1,908 | 1,409 |
| 2005 | 1,656 | 1,583 | 1,456 | 1,569 | 1,505 | 1,588 | 1,620 | 1,649 | 1,850 | 2,156 | 2,183 | 1,268 |
| 2006 | 1,336 | 1,418 | 1,419 | 1,703 | 1,951 | 1,865 | 1,888 | 1,842 | 2,095 | 2,454 | 2,032 | 1,589 |
| 2007 | 1,204 | 1,310 | 1,461 | 1,667 | 1,892 | 2,071 | 2,105 | 2,159 | 2,387 | 2,424 | 2,283 | 1,804 |
| 2008 | 1,614 | 1,257 | 1,587 | 1,494 | 1,606 | 1,725 | 1,893 | 2,135 | 2,049 | 2,337 | 2,045 | 1,225 |
| 2009 | 1,274 | 1,519 | 1,455 | 1,691 | 1,728 | 1,827 | 1,858 | 2,150 | 2,252 | 2,307 | 2,009 | 1,568 |
| 2010 | 1,569 | 1,524 | 1,406 | 1,473 | 1,569 | 1,775 | 1,981 | 1,846 | 1,937 | 2,265 | 2,073 | 1,736 |
| 2011 | 1,487 | 1,480 | 1,464 | 1,759 | 1,683 | 1,697 | 1,849 | 2,050 | 2,266 | 2,097 | 1,986 | 1,660 |
| 2012 | 1,825 | 1,344 | 1,547 | 1,740 | 1,959 | 1,904 | 2,246 | 2,440 | 2,498 | 2,602 | 2,082 | 1,803 |
| 2013 | 1,756 | 1,675 | 1,533 | 1,601 | 1,773 | 1,956 | 1,995 | 2,000 | 2,328 | 1,991 | 1,805 | 1,397 |
| 2014 | 1,392 | 1,549 | 1,650 | 1,616 | 1,740 | 1,726 | 1,894 | 1,778 | 1,857 | 1,911 | 1,702 | 1,544 |
| 2015 | 1,738 | 1,279 | 1,327 | 1,313 | 1,310 | 1,265 | 1,312 | 1,272 | 1,470 | 1,827 | 1,594 | 1,462 |
| 2016 | 1,650 | 1,304 | 1,420 | 1,492 | 1,566 | 1,598 | 1,826 | 1,742 | 1,903 | 1,860 | 1,580 | 1,374 |
| 2017 | 1,471 | 1,359 | 1,316 | 1,438 | 1,478 | 1,552 | 1,574 | 1,767 | 1,706 | 1,980 | 1,775 | 1,310 |
| 2018 | 1,481 | 1,342 | 1,473 | 1,461 | 1,454 | 1,515 | 1,504 | 1,587 | 1,769 | 1,732 | 1,487 | 1,346 |
| 2019 | 1,246 | 1,199 | 1,220 | 1,143 | 1,210 | 1,320 | 1,439 | 1,705 | 1,883 | 1,986 | 1,905 | 1,628 |
| 2020 | 1,695 | 1,360 | 1,404 | 1,443 | 1,370 | 1,529 | 1,601 | 1,665 | 1,518 | 1,606 | 1,572 | 1,265 |
| 2021 | 1,328 | 1,256 | 1,377 | 1,419 | 1,597 | 1,503 | 1,388 | 1,496 | 1,507 | 1,808 | 1,760 | 1,393 |
| 2022 | -- | -- | -- | -- | -- | -- | -- | -- | -- | -- | -- | -- |
| 2023 | -- | -- | -- | -- | -- | -- | -- | -- | -- | -- | -- | -- |
| 2024 | -- | |||||||||||
| - = No Data Reported; -- = Not Applicable; NA = Not Available; W = Withheld to avoid disclosure of individual company data. |
| Release Date: 3/29/2024 |
| Next Release Date: 4/30/2024 |