|
Download Data (XLS File) |
|
||||||||
|
||||||||
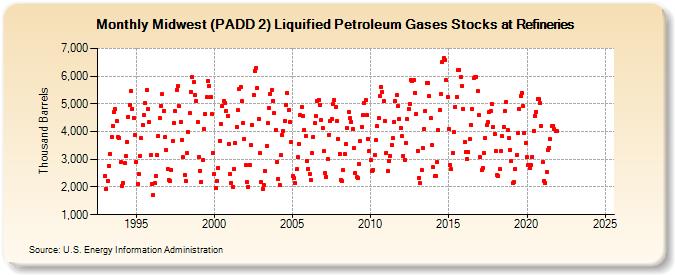
| Midwest (PADD 2) Liquified Petroleum Gases Stocks at Refineries (Thousand Barrels) | ||||||||
| Year | Jan | Feb | Mar | Apr | May | Jun | Jul | Aug | Sep | Oct | Nov | Dec |
|---|---|---|---|---|---|---|---|---|---|---|---|---|
| 1993 | 2,405 | 1,920 | 2,234 | 2,768 | 3,200 | 3,808 | 4,212 | 4,705 | 4,809 | 4,368 | 3,801 | 3,775 |
| 1994 | 2,889 | 2,052 | 2,154 | 2,849 | 3,117 | 3,627 | 4,528 | 4,975 | 5,470 | 4,827 | 4,493 | 3,883 |
| 1995 | 2,919 | 2,118 | 2,476 | 3,130 | 3,751 | 4,242 | 4,582 | 5,027 | 5,508 | 4,811 | 4,334 | 3,137 |
| 1996 | 2,103 | 1,715 | 2,128 | 2,402 | 3,150 | 3,856 | 4,485 | 4,932 | 5,341 | 4,748 | 3,790 | 3,338 |
| 1997 | 2,639 | 2,260 | 2,215 | 2,627 | 3,644 | 4,310 | 4,739 | 5,502 | 5,648 | 4,907 | 4,347 | 3,711 |
| 1998 | 3,065 | 2,441 | 2,222 | 3,233 | 3,982 | 4,652 | 5,430 | 5,966 | 5,784 | 5,308 | 5,119 | 4,345 |
| 1999 | 3,086 | 2,595 | 2,198 | 2,964 | 4,096 | 4,643 | 5,232 | 5,832 | 5,647 | 5,240 | 4,622 | 3,238 |
| 2000 | 2,474 | 1,960 | 2,212 | 2,699 | 3,670 | 4,286 | 4,905 | 5,114 | 5,015 | 4,751 | 4,554 | 3,564 |
| 2001 | 2,466 | 2,159 | 2,011 | 2,651 | 3,582 | 4,176 | 4,766 | 5,527 | 5,612 | 5,086 | 4,317 | 3,741 |
| 2002 | 2,781 | 2,176 | 2,001 | 2,796 | 3,506 | 4,252 | 5,327 | 6,193 | 6,296 | 5,580 | 4,462 | 3,224 |
| 2003 | 2,178 | 1,925 | 2,065 | 2,576 | 3,482 | 4,306 | 4,867 | 5,368 | 5,514 | 5,119 | 4,658 | 4,060 |
| 2004 | 2,916 | 2,296 | 2,089 | 3,139 | 3,880 | 4,022 | 4,390 | 4,969 | 5,394 | 4,785 | 4,329 | 3,618 |
| 2005 | 2,388 | 2,308 | 2,149 | 2,640 | 3,068 | 3,555 | 4,598 | 4,900 | 4,552 | 4,073 | 3,845 | 2,953 |
| 2006 | 2,658 | 2,482 | 2,241 | 3,226 | 3,820 | 4,291 | 4,544 | 5,114 | 5,141 | 4,948 | 4,415 | 4,142 |
| 2007 | 3,285 | 2,493 | 2,367 | 3,003 | 3,888 | 4,393 | 4,443 | 4,991 | 5,144 | 4,894 | 4,378 | 3,746 |
| 2008 | 3,205 | 2,258 | 2,215 | 2,607 | 3,187 | 3,554 | 4,129 | 4,716 | 4,475 | 4,359 | 4,086 | 3,389 |
| 2009 | 2,492 | 2,350 | 2,325 | 2,828 | 3,645 | 4,166 | 4,585 | 5,035 | 5,135 | 4,602 | 3,732 | 3,296 |
| 2010 | 2,959 | 2,567 | 2,624 | 3,142 | 3,679 | 4,183 | 4,474 | 5,276 | 5,621 | 5,424 | 5,093 | 4,376 |
| 2011 | 3,243 | 2,574 | 2,941 | 3,126 | 3,515 | 3,751 | 4,355 | 5,095 | 5,306 | 4,911 | 4,457 | 4,139 |
| 2012 | 3,833 | 3,113 | 2,985 | 3,574 | 4,446 | 4,816 | 5,002 | 5,849 | 5,838 | 5,851 | 5,404 | 4,649 |
| 2013 | 3,313 | 2,335 | 2,133 | 2,620 | 3,410 | 4,093 | 4,754 | 5,768 | 5,761 | 5,271 | 4,484 | 3,499 |
| 2014 | 2,710 | 2,397 | 2,393 | 2,895 | 4,058 | 4,773 | 5,361 | 6,504 | 6,656 | 6,564 | 5,850 | 5,251 |
| 2015 | 4,093 | 2,787 | 2,638 | 3,238 | 3,975 | 4,900 | 5,258 | 6,213 | 6,234 | 5,973 | 5,660 | 4,819 |
| 2016 | 3,636 | 3,256 | 3,015 | 3,252 | 3,716 | 4,238 | 4,825 | 5,925 | 5,953 | 5,968 | 5,448 | 4,587 |
| 2017 | 3,079 | 2,605 | 2,696 | 3,241 | 3,772 | 4,223 | 4,342 | 4,700 | 4,759 | 5,010 | 4,168 | 3,912 |
| 2018 | 3,281 | 2,418 | 2,413 | 2,646 | 3,307 | 3,830 | 4,178 | 4,736 | 5,071 | 4,072 | 3,771 | 3,339 |
| 2019 | 2,950 | 2,138 | 2,172 | 2,660 | 3,156 | 3,952 | 4,808 | 5,291 | 5,405 | 4,907 | 3,959 | 3,594 |
| 2020 | 3,068 | 2,802 | 2,685 | 2,786 | 3,091 | 4,033 | 4,566 | 4,719 | 5,179 | 5,176 | 5,026 | 4,214 |
| 2021 | 2,885 | 2,229 | 2,146 | 2,545 | 3,344 | 3,422 | 3,725 | 4,188 | 4,203 | 4,089 | 4,008 | 4,006 |
| 2022 | -- | -- | -- | -- | -- | -- | -- | -- | -- | -- | -- | -- |
| 2023 | -- | -- | -- | -- | -- | -- | -- | -- | -- | -- | -- | -- |
| 2024 | -- | |||||||||||
| - = No Data Reported; -- = Not Applicable; NA = Not Available; W = Withheld to avoid disclosure of individual company data. |
| Release Date: 3/29/2024 |
| Next Release Date: 4/30/2024 |