|
Download Data (XLS File) |
|
||||||||
|
||||||||
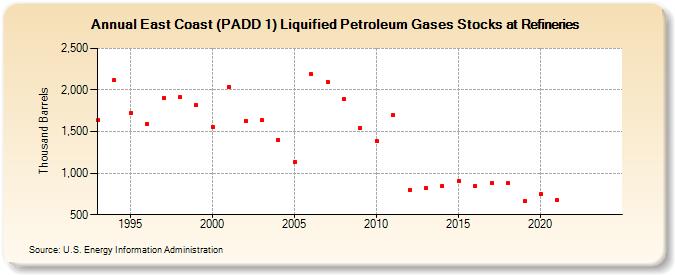
| East Coast (PADD 1) Liquified Petroleum Gases Stocks at Refineries (Thousand Barrels) | ||||||||
| Decade | Year-0 | Year-1 | Year-2 | Year-3 | Year-4 | Year-5 | Year-6 | Year-7 | Year-8 | Year-9 |
|---|---|---|---|---|---|---|---|---|---|---|
| 1990's | 1,637 | 2,115 | 1,718 | 1,594 | 1,904 | 1,913 | 1,820 | |||
| 2000's | 1,557 | 2,038 | 1,631 | 1,638 | 1,403 | 1,138 | 2,190 | 2,101 | 1,886 | 1,544 |
| 2010's | 1,386 | 1,697 | 803 | 819 | 846 | 905 | 844 | 883 | 878 | 663 |
| 2020's | 749 | 676 | -- | -- |
| - = No Data Reported; -- = Not Applicable; NA = Not Available; W = Withheld to avoid disclosure of individual company data. |
| Release Date: 6/28/2024 |
| Next Release Date: 8/30/2024 |