|
Download Data (XLS File) |
|
||||||||
|
||||||||
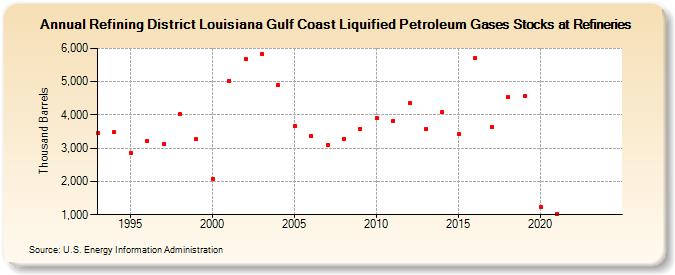
| Refining District Louisiana Gulf Coast Liquified Petroleum Gases Stocks at Refineries (Thousand Barrels) | ||||||||
| Decade | Year-0 | Year-1 | Year-2 | Year-3 | Year-4 | Year-5 | Year-6 | Year-7 | Year-8 | Year-9 |
|---|---|---|---|---|---|---|---|---|---|---|
| 1990's | 3,465 | 3,476 | 2,856 | 3,217 | 3,139 | 4,019 | 3,267 | |||
| 2000's | 2,075 | 5,033 | 5,680 | 5,840 | 4,897 | 3,660 | 3,369 | 3,100 | 3,279 | 3,583 |
| 2010's | 3,896 | 3,817 | 4,349 | 3,584 | 4,080 | 3,415 | 5,712 | 3,651 | 4,539 | 4,559 |
| 2020's | 1,245 | 1,014 | -- | -- |
| - = No Data Reported; -- = Not Applicable; NA = Not Available; W = Withheld to avoid disclosure of individual company data. |
| Release Date: 3/29/2024 |
| Next Release Date: 8/30/2024 |