|
Download Data (XLS File) |
|
||||||||
|
||||||||
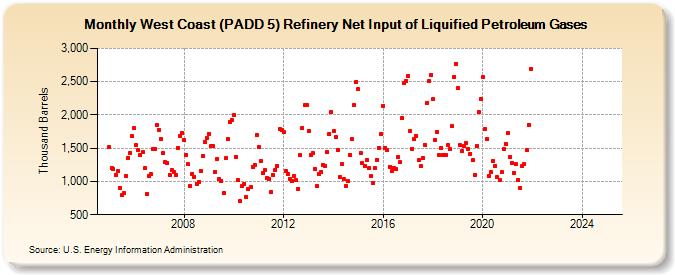
| West Coast (PADD 5) Refinery Net Input of Liquified Petroleum Gases (Thousand Barrels) | ||||||||
| Year | Jan | Feb | Mar | Apr | May | Jun | Jul | Aug | Sep | Oct | Nov | Dec |
|---|---|---|---|---|---|---|---|---|---|---|---|---|
| 2005 | 1,518 | 1,197 | 1,188 | 1,094 | 1,150 | 908 | 791 | 821 | 1,085 | 1,356 | 1,433 | 1,677 |
| 2006 | 1,802 | 1,545 | 1,469 | 1,397 | 1,436 | 1,195 | 808 | 1,081 | 1,105 | 1,489 | 1,486 | 1,846 |
| 2007 | 1,775 | 1,631 | 1,423 | 1,287 | 1,271 | 1,104 | 1,171 | 1,147 | 1,093 | 1,510 | 1,682 | 1,731 |
| 2008 | 1,619 | 1,398 | 1,258 | 936 | 1,114 | 1,071 | 965 | 996 | 1,163 | 1,385 | 1,596 | 1,656 |
| 2009 | 1,719 | 1,530 | 1,527 | 1,145 | 1,340 | 1,033 | 1,004 | 826 | 1,347 | 1,640 | 1,892 | 1,919 |
| 2010 | 1,993 | 1,375 | 1,019 | 699 | 927 | 965 | 760 | 879 | 916 | 1,221 | 1,244 | 1,699 |
| 2011 | 1,521 | 1,305 | 1,130 | 1,171 | 1,053 | 1,034 | 842 | 1,098 | 1,178 | 1,239 | 1,784 | 1,769 |
| 2012 | 1,745 | 1,156 | 1,108 | 1,038 | 1,008 | 1,080 | 1,016 | 891 | 1,395 | 1,807 | 2,145 | 2,154 |
| 2013 | 1,765 | 1,398 | 1,425 | 1,192 | 927 | 1,107 | 1,148 | 1,244 | 1,229 | 1,446 | 1,710 | 2,041 |
| 2014 | 1,751 | 1,663 | 1,475 | 1,064 | 1,257 | 1,031 | 935 | 1,012 | 1,404 | 1,633 | 2,142 | 2,495 |
| 2015 | 2,385 | 1,425 | 1,273 | 1,229 | 1,329 | 1,195 | 1,080 | 982 | 1,198 | 1,323 | 1,504 | 1,720 |
| 2016 | 2,141 | 1,507 | 1,472 | 1,224 | 1,151 | 1,209 | 1,192 | 1,364 | 1,287 | 1,951 | 2,481 | 2,511 |
| 2017 | 2,585 | 1,754 | 1,495 | 1,634 | 1,683 | 1,318 | 1,232 | 1,353 | 1,554 | 2,184 | 2,511 | 2,605 |
| 2018 | 2,233 | 1,626 | 1,748 | 1,399 | 1,506 | 1,402 | 1,400 | 1,545 | 1,486 | 1,826 | 2,568 | 2,771 |
| 2019 | 2,408 | 1,541 | 1,464 | 1,539 | 1,579 | 1,482 | 1,417 | 1,315 | 1,097 | 1,535 | 2,044 | 2,233 |
| 2020 | 2,566 | 1,790 | 1,637 | 1,086 | 1,136 | 1,305 | 1,235 | 1,064 | 1,029 | 1,137 | 1,481 | 1,569 |
| 2021 | 1,731 | 1,368 | 1,276 | 1,127 | 1,261 | 1,022 | 902 | 1,228 | 1,261 | 1,468 | 1,855 | 2,693 |
| 2022 | -- | -- | -- | -- | -- | -- | -- | -- | -- | -- | -- | -- |
| 2023 | -- | -- | -- | -- | -- | -- | -- | -- | -- | -- | -- | -- |
| 2024 | -- | |||||||||||
| - = No Data Reported; -- = Not Applicable; NA = Not Available; W = Withheld to avoid disclosure of individual company data. |
| Release Date: 3/29/2024 |
| Next Release Date: 4/30/2024 |
Referring Pages: