|
Download Data (XLS File) |
|
||||||||
|
||||||||
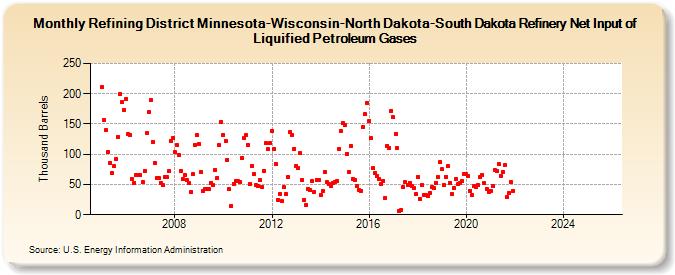
| Refining District Minnesota-Wisconsin-North Dakota-South Dakota Refinery Net Input of Liquified Petroleum Gases (Thousand Barrels) | ||||||||
| Year | Jan | Feb | Mar | Apr | May | Jun | Jul | Aug | Sep | Oct | Nov | Dec |
|---|---|---|---|---|---|---|---|---|---|---|---|---|
| 2005 | 211 | 156 | 140 | 104 | 86 | 69 | 80 | 92 | 129 | 199 | 186 | 173 |
| 2006 | 192 | 133 | 132 | 59 | 53 | 65 | 66 | 65 | 54 | 72 | 135 | 169 |
| 2007 | 189 | 121 | 86 | 61 | 60 | 53 | 49 | 63 | 62 | 72 | 122 | 127 |
| 2008 | 103 | 115 | 99 | 72 | 59 | 66 | 58 | 52 | 38 | 67 | 116 | 131 |
| 2009 | 117 | 70 | 40 | 42 | 43 | 42 | 53 | 49 | 74 | 61 | 115 | 153 |
| 2010 | 132 | 122 | 91 | 42 | 15 | 51 | 56 | 55 | 54 | 94 | 126 | 131 |
| 2011 | 116 | 50 | 81 | 67 | 49 | 47 | 57 | 46 | 73 | 118 | 108 | 118 |
| 2012 | 139 | 108 | 84 | 25 | 35 | 22 | 45 | 34 | 62 | 136 | 132 | 109 |
| 2013 | 81 | 77 | 102 | 58 | 25 | 16 | 43 | 41 | 56 | 38 | 58 | 58 |
| 2014 | 33 | 40 | 71 | 54 | 50 | 48 | 53 | 54 | 55 | 109 | 139 | 151 |
| 2015 | 148 | 101 | 71 | 114 | 59 | 58 | 47 | 41 | 39 | 145 | 166 | 185 |
| 2016 | 155 | 126 | 77 | 69 | 64 | 59 | 50 | 56 | 28 | 114 | 110 | 172 |
| 2017 | 161 | 134 | 111 | 6 | 8 | 45 | 54 | 49 | 53 | 47 | 44 | 34 |
| 2018 | 63 | 26 | 49 | 33 | 32 | 31 | 36 | 45 | 44 | 53 | 62 | 87 |
| 2019 | 75 | 49 | 63 | 80 | 53 | 34 | 44 | 59 | 50 | 53 | 55 | 68 |
| 2020 | 67 | 64 | 40 | 32 | 47 | 45 | 49 | 62 | 66 | 52 | 43 | 38 |
| 2021 | 40 | 47 | 74 | 72 | 84 | 64 | 71 | 82 | 30 | 36 | 54 | 40 |
| 2022 | -- | -- | -- | -- | -- | -- | -- | -- | -- | -- | -- | -- |
| 2023 | -- | -- | -- | -- | -- | -- | -- | -- | -- | -- | -- | -- |
| 2024 | -- | |||||||||||
| - = No Data Reported; -- = Not Applicable; NA = Not Available; W = Withheld to avoid disclosure of individual company data. |
| Release Date: 3/29/2024 |
| Next Release Date: 4/30/2024 |