|
Download Data (XLS File) |
|
||||||||
|
||||||||
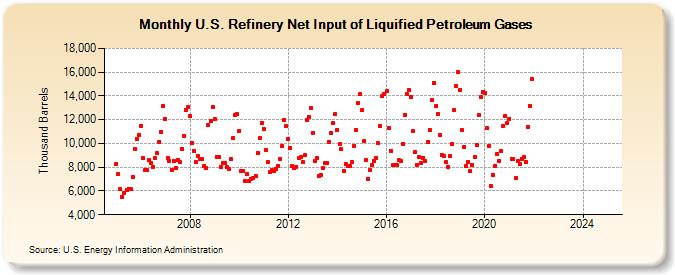
| U.S. Refinery Net Input of Liquified Petroleum Gases (Thousand Barrels) | ||||||||
| Year | Jan | Feb | Mar | Apr | May | Jun | Jul | Aug | Sep | Oct | Nov | Dec |
|---|---|---|---|---|---|---|---|---|---|---|---|---|
| 2005 | 8,275 | 7,422 | 6,166 | 5,495 | 5,858 | 6,086 | 6,170 | 6,136 | 7,201 | 9,563 | 10,408 | 10,742 |
| 2006 | 11,498 | 8,806 | 7,740 | 7,737 | 8,604 | 8,386 | 8,027 | 8,793 | 9,173 | 10,150 | 10,968 | 13,159 |
| 2007 | 12,021 | 8,794 | 8,551 | 7,795 | 8,504 | 7,961 | 8,610 | 8,469 | 9,572 | 10,655 | 12,848 | 13,057 |
| 2008 | 12,296 | 10,051 | 9,388 | 8,456 | 8,978 | 8,726 | 8,656 | 8,114 | 7,931 | 11,532 | 11,876 | 13,087 |
| 2009 | 12,044 | 8,860 | 8,853 | 7,996 | 8,348 | 8,340 | 7,989 | 7,868 | 8,663 | 10,451 | 12,366 | 12,438 |
| 2010 | 11,063 | 7,671 | 7,694 | 6,852 | 7,422 | 6,803 | 7,030 | 7,100 | 7,263 | 9,219 | 10,418 | 11,709 |
| 2011 | 11,242 | 9,441 | 8,446 | 7,582 | 7,730 | 7,719 | 7,808 | 8,097 | 8,659 | 9,824 | 12,009 | 11,458 |
| 2012 | 10,338 | 9,581 | 8,115 | 7,915 | 8,040 | 8,747 | 8,857 | 8,406 | 8,985 | 11,960 | 12,247 | 12,984 |
| 2013 | 10,879 | 8,508 | 8,738 | 7,295 | 7,372 | 7,956 | 8,364 | 8,333 | 10,123 | 10,901 | 11,711 | 12,475 |
| 2014 | 11,167 | 9,914 | 9,509 | 7,683 | 8,273 | 8,121 | 8,130 | 8,413 | 9,775 | 11,146 | 13,441 | 14,138 |
| 2015 | 12,805 | 10,178 | 8,629 | 7,020 | 7,790 | 8,206 | 8,480 | 8,789 | 9,998 | 11,475 | 13,997 | 14,129 |
| 2016 | 14,413 | 11,333 | 9,399 | 8,205 | 8,211 | 8,197 | 8,583 | 8,480 | 9,994 | 12,428 | 14,121 | 14,517 |
| 2017 | 13,914 | 11,020 | 9,297 | 8,221 | 8,900 | 8,340 | 8,815 | 8,539 | 10,086 | 11,160 | 13,650 | 15,088 |
| 2018 | 13,153 | 12,486 | 10,708 | 9,025 | 8,909 | 8,405 | 8,055 | 8,976 | 9,969 | 12,800 | 14,871 | 16,018 |
| 2019 | 14,530 | 11,106 | 9,692 | 8,064 | 8,423 | 7,640 | 8,183 | 8,859 | 9,867 | 12,353 | 13,878 | 14,300 |
| 2020 | 14,251 | 11,282 | 9,822 | 6,450 | 7,383 | 8,099 | 9,082 | 8,523 | 9,328 | 11,456 | 12,290 | 11,688 |
| 2021 | 12,090 | 8,682 | 8,690 | 7,084 | 8,517 | 8,245 | 8,728 | 8,849 | 8,476 | 11,379 | 13,181 | 15,399 |
| 2022 | -- | -- | -- | -- | -- | -- | -- | -- | -- | -- | -- | -- |
| 2023 | -- | -- | -- | -- | -- | -- | -- | -- | -- | -- | -- | -- |
| 2024 | -- | |||||||||||
| - = No Data Reported; -- = Not Applicable; NA = Not Available; W = Withheld to avoid disclosure of individual company data. |
| Release Date: 3/29/2024 |
| Next Release Date: 4/30/2024 |
Referring Pages: