|
Download Data (XLS File) |
|
||||||||
|
||||||||
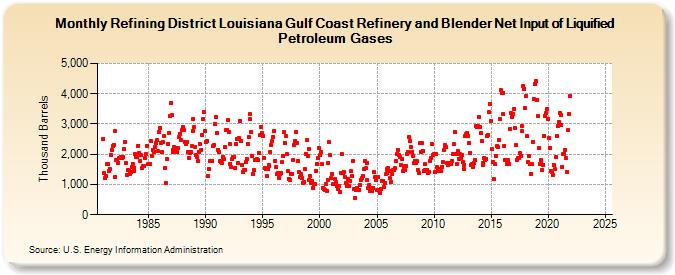
| Refining District Louisiana Gulf Coast Refinery and Blender Net Input of Liquified Petroleum Gases (Thousand Barrels) | ||||||||
| Year | Jan | Feb | Mar | Apr | May | Jun | Jul | Aug | Sep | Oct | Nov | Dec |
|---|---|---|---|---|---|---|---|---|---|---|---|---|
| 1981 | 2,517 | 1,373 | 1,201 | 1,275 | 1,664 | 1,671 | 1,439 | 1,514 | 1,986 | 2,140 | 2,274 | 2,315 |
| 1982 | 2,763 | 1,253 | 1,819 | 1,805 | 1,722 | 1,880 | 1,869 | 1,902 | 1,878 | 1,895 | 2,168 | 2,402 |
| 1983 | 1,712 | 1,304 | 1,493 | 1,473 | 1,350 | 1,408 | 1,563 | 1,685 | 1,451 | 1,558 | 2,013 | 1,904 |
| 1984 | 1,899 | 2,282 | 2,047 | 1,792 | 1,962 | 1,536 | 1,600 | 1,625 | 1,891 | 1,992 | 2,273 | 1,675 |
| 1985 | 1,675 | 1,665 | 2,446 | 1,957 | 2,144 | 2,127 | 2,077 | 2,232 | 2,359 | 2,455 | 2,095 | 2,725 |
| 1986 | 2,872 | 2,379 | 2,067 | 2,393 | 2,591 | 1,548 | 1,040 | 1,841 | 2,346 | 2,708 | 3,280 | 3,692 |
| 1987 | 3,293 | 2,070 | 2,149 | 2,250 | 2,204 | 2,142 | 2,083 | 2,195 | 2,574 | 2,685 | 2,465 | 2,798 |
| 1988 | 2,889 | 2,793 | 2,400 | 2,330 | 2,419 | 2,063 | 1,890 | 2,042 | 2,073 | 2,271 | 2,767 | 3,180 |
| 1989 | 2,894 | 2,248 | 1,985 | 1,905 | 1,766 | 2,083 | 2,332 | 2,152 | 2,649 | 3,170 | 3,401 | 2,782 |
| 1990 | 2,418 | 2,431 | 1,288 | 1,519 | 1,784 | 1,771 | 1,776 | 1,789 | 2,267 | 2,307 | 3,005 | 3,229 |
| 1991 | 2,711 | 2,146 | 2,057 | 1,776 | 1,748 | 1,726 | 1,919 | 1,828 | 2,246 | 2,792 | 2,806 | 3,128 |
| 1992 | 2,728 | 2,343 | 1,688 | 1,574 | 1,835 | 1,912 | 1,895 | 1,538 | 2,336 | 2,496 | 1,702 | 2,548 |
| 1993 | 3,110 | 2,424 | 1,633 | 1,412 | 1,469 | 1,482 | 1,741 | 1,843 | 2,338 | 2,568 | 3,331 | 3,165 |
| 1994 | 2,738 | 1,953 | 1,350 | 1,465 | 1,809 | 1,802 | 1,840 | 1,824 | 2,037 | 2,622 | 2,898 | 2,688 |
| 1995 | 2,605 | 1,868 | 1,560 | 1,496 | 1,281 | 1,498 | 1,598 | 1,647 | 2,075 | 2,298 | 2,436 | 2,584 |
| 1996 | 2,783 | 1,792 | 1,569 | 1,332 | 1,382 | 1,226 | 1,352 | 1,365 | 1,734 | 1,952 | 2,730 | 2,381 |
| 1997 | 2,605 | 1,997 | 1,435 | 1,192 | 1,181 | 1,148 | 1,359 | 1,361 | 1,801 | 2,307 | 2,449 | 2,736 |
| 1998 | 2,379 | 1,780 | 1,404 | 1,234 | 1,338 | 1,217 | 1,062 | 1,072 | 1,512 | 2,023 | 2,458 | 1,940 |
| 1999 | 2,183 | 1,156 | 1,270 | 1,064 | 1,105 | 871 | 1,007 | 1,000 | 1,453 | 1,679 | 1,871 | 2,218 |
| 2000 | 1,961 | 2,080 | 1,681 | 872 | 836 | 809 | 1,004 | 799 | 1,161 | 1,720 | 2,392 | 1,977 |
| 2001 | 1,198 | 1,347 | 1,000 | 1,029 | 1,179 | 1,073 | 948 | 863 | 956 | 765 | 1,393 | 1,992 |
| 2002 | 1,384 | 1,422 | 1,263 | 1,044 | 984 | 944 | 1,178 | 960 | 1,121 | 1,439 | 1,280 | 1,771 |
| 2003 | 856 | 552 | 817 | 877 | 813 | 829 | 978 | 1,158 | 1,205 | 1,267 | 1,501 | 1,764 |
| 2004 | 1,528 | 1,696 | 1,147 | 881 | 974 | 777 | 898 | 784 | 877 | 1,417 | 1,242 | 1,136 |
| 2005 | 816 | 1,239 | 826 | 728 | 846 | 1,110 | 1,119 | 901 | 1,061 | 1,330 | 1,517 | 1,365 |
| 2006 | 1,534 | 1,453 | 1,198 | 1,090 | 1,338 | 1,488 | 1,493 | 1,544 | 1,771 | 1,995 | 2,153 | 1,981 |
| 2007 | 1,906 | 1,647 | 1,850 | 1,433 | 1,521 | 1,486 | 1,597 | 1,607 | 2,016 | 2,066 | 2,585 | 2,439 |
| 2008 | 2,251 | 2,057 | 1,942 | 1,706 | 1,790 | 1,717 | 1,766 | 1,488 | 1,369 | 2,361 | 2,089 | 2,363 |
| 2009 | 2,117 | 1,459 | 1,668 | 1,488 | 1,488 | 1,484 | 1,393 | 1,427 | 1,767 | 1,887 | 2,326 | 1,975 |
| 2010 | 2,011 | 1,397 | 1,994 | 1,569 | 1,461 | 1,498 | 1,464 | 1,448 | 1,581 | 1,748 | 2,125 | 2,294 |
| 2011 | 2,285 | 2,234 | 1,726 | 1,636 | 1,698 | 1,723 | 1,693 | 1,779 | 1,993 | 2,326 | 2,724 | 2,016 |
| 2012 | 1,665 | 2,106 | 1,851 | 2,009 | 1,866 | 1,984 | 1,730 | 1,507 | 1,655 | 2,616 | 2,664 | 2,709 |
| 2013 | 2,610 | 2,379 | 2,047 | 1,654 | 1,684 | 1,570 | 1,725 | 1,795 | 2,944 | 2,887 | 2,921 | 3,217 |
| 2014 | 2,913 | 2,701 | 2,425 | 1,647 | 1,708 | 1,867 | 1,811 | 1,852 | 2,589 | 2,646 | 3,387 | 3,672 |
| 2015 | 3,089 | 2,160 | 1,759 | 1,177 | 1,686 | 1,926 | 2,270 | 2,231 | 2,480 | 3,163 | 4,121 | 4,033 |
| 2016 | 4,016 | 3,327 | 2,276 | 1,817 | 1,818 | 1,672 | 1,795 | 1,669 | 2,835 | 3,358 | 3,238 | 3,336 |
| 2017 | 3,500 | 2,869 | 2,306 | 1,822 | 1,862 | 1,870 | 2,043 | 1,933 | 2,945 | 2,766 | 4,239 | 4,167 |
| 2018 | 3,520 | 3,930 | 2,590 | 1,741 | 1,932 | 1,672 | 1,356 | 1,676 | 2,415 | 3,814 | 4,334 | 4,423 |
| 2019 | 3,796 | 3,271 | 2,209 | 1,675 | 1,797 | 1,729 | 1,489 | 1,656 | 2,607 | 3,255 | 3,364 | 3,495 |
| 2020 | 3,148 | 2,529 | 2,213 | 1,443 | 1,414 | 1,299 | 1,659 | 1,503 | 1,923 | 2,610 | 2,928 | 3,073 |
| 2021 | 3,363 | 3,308 | 2,966 | 1,590 | 2,007 | 2,022 | 2,135 | 1,863 | 1,419 | 2,808 | 3,331 | 3,918 |
| 2022 | -- | -- | -- | -- | -- | -- | -- | -- | -- | -- | -- | -- |
| 2023 | -- | -- | -- | -- | -- | -- | -- | -- | -- | -- | -- | -- |
| 2024 | -- | |||||||||||
| - = No Data Reported; -- = Not Applicable; NA = Not Available; W = Withheld to avoid disclosure of individual company data. |
| Release Date: 3/29/2024 |
| Next Release Date: 4/30/2024 |