|
Download Data (XLS File) |
|
||||||||
|
||||||||
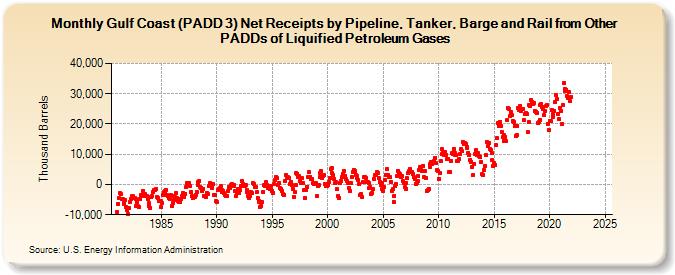
| Gulf Coast (PADD 3) Net Receipts by Pipeline, Tanker, Barge and Rail from Other PADDs of Liquified Petroleum Gases (Thousand Barrels) | ||||||||
| Year | Jan | Feb | Mar | Apr | May | Jun | Jul | Aug | Sep | Oct | Nov | Dec |
|---|---|---|---|---|---|---|---|---|---|---|---|---|
| 1981 | -9,183 | -6,302 | -4,590 | -2,906 | -3,108 | -4,852 | -4,949 | -6,516 | -5,631 | -5,282 | -7,305 | -8,518 |
| 1982 | -9,921 | -7,760 | -5,839 | -4,951 | -3,902 | -3,947 | -4,404 | -4,547 | -4,921 | -7,182 | -5,657 | -7,235 |
| 1983 | -7,391 | -4,714 | -3,414 | -3,840 | -2,079 | -3,256 | -3,095 | -3,708 | -3,657 | -4,830 | -6,177 | -6,983 |
| 1984 | -7,623 | -4,274 | -3,927 | -2,409 | -1,932 | -1,725 | -1,592 | -4,105 | -4,330 | -5,459 | -5,310 | -5,611 |
| 1985 | -7,541 | -6,143 | -3,372 | -2,605 | -2,307 | -1,710 | -3,382 | -3,905 | -4,486 | -4,660 | -3,580 | -7,172 |
| 1986 | -6,197 | -3,917 | -5,103 | -4,261 | -2,952 | -4,570 | -5,444 | -5,848 | -5,634 | -4,848 | -3,879 | -2,959 |
| 1987 | -4,296 | -3,153 | -3,030 | -732 | 349 | -216 | 505 | -385 | -2,497 | -3,955 | -4,418 | -4,146 |
| 1988 | -4,022 | -3,513 | -2,339 | -316 | 749 | 1,088 | -837 | -1,008 | -2,104 | -1,577 | -3,675 | -3,840 |
| 1989 | -4,004 | -2,781 | -3,160 | -437 | -164 | 433 | 97 | -1,008 | 36 | -3,476 | -3,573 | -5,554 |
| 1990 | -5,765 | -1,919 | -1,464 | -1,119 | -660 | -1,668 | -2,559 | -2,235 | -2,980 | -3,587 | -3,947 | -3,804 |
| 1991 | -2,232 | -842 | -1,200 | -154 | 288 | -207 | -562 | -102 | -2,063 | -3,665 | -2,499 | -1,453 |
| 1992 | -2,907 | -1,758 | -569 | 1,214 | 259 | -29 | -504 | -263 | -1,895 | -2,363 | -3,704 | -4,412 |
| 1993 | -3,796 | -2,615 | -2,933 | 550 | 173 | -789 | -924 | -2,647 | -4,431 | -5,323 | -5,841 | -7,429 |
| 1994 | -6,954 | -5,958 | -2,488 | -339 | -454 | 737 | -208 | -1,080 | -900 | -1,638 | -456 | -1,220 |
| 1995 | -2,226 | -2,679 | 177 | 1,390 | 2,501 | 1,994 | -73 | 343 | -1,085 | -1,485 | -2,088 | -3,138 |
| 1996 | -3,589 | -3,410 | 1,311 | 3,109 | 2,189 | 2,346 | 2,202 | 189 | 926 | -99 | -1,426 | -4,007 |
| 1997 | -2,341 | -334 | 3,734 | 3,578 | 2,598 | 2,668 | 1,105 | 506 | 1,980 | 409 | -1,991 | -4,504 |
| 1998 | -1,942 | -819 | -778 | 2,483 | 3,986 | 2,510 | 1,660 | 1,715 | 524 | 32 | 483 | 368 |
| 1999 | -3,863 | -537 | -185 | 2,312 | 3,683 | 4,375 | 2,131 | 2,776 | 3,077 | 256 | -358 | -554 |
| 2000 | -103 | 672 | 2,210 | 5,067 | 5,451 | 3,806 | 3,087 | 1,725 | 454 | 777 | -1,508 | -3,802 |
| 2001 | -4,400 | 494 | 1,286 | 2,353 | 3,606 | 4,452 | 2,664 | 2,954 | 1,675 | 1,047 | 334 | -1,319 |
| 2002 | -2,306 | 351 | 2,478 | 3,984 | 4,892 | 4,350 | 3,260 | 2,944 | 2,103 | 1,504 | -5 | -3,361 |
| 2003 | -3,217 | -4,053 | 758 | 2,377 | 2,546 | 2,159 | 942 | 952 | 564 | -1,066 | -730 | -3,009 |
| 2004 | -2,803 | -1,639 | 1,819 | 3,022 | 3,037 | 4,021 | 3,652 | 2,076 | 798 | -53 | 435 | -1,448 |
| 2005 | -2,143 | -866 | 1,447 | 3,281 | 5,061 | 3,188 | 2,448 | 2,376 | 979 | -2,031 | -1,542 | -5,690 |
| 2006 | -3,731 | -650 | 71 | 2,805 | 4,578 | 3,678 | 3,497 | 2,361 | 2,723 | 1,039 | 635 | -937 |
| 2007 | 598 | -1,356 | 1,995 | 3,818 | 4,394 | 5,110 | 4,167 | 4,252 | 3,371 | 2,320 | 1,758 | 280 |
| 2008 | 502 | 1,011 | 2,651 | 4,718 | 5,890 | 5,823 | 4,441 | 6,226 | 2,312 | 4,373 | 2,289 | -2,019 |
| 2009 | -1,911 | -1,423 | 5,841 | 6,914 | 7,356 | 6,826 | 7,408 | 7,914 | 8,858 | 7,152 | 4,903 | 4,469 |
| 2010 | 1,901 | 3,918 | 7,601 | 10,024 | 11,573 | 10,870 | 9,867 | 10,652 | 9,840 | 8,570 | 8,492 | 4,077 |
| 2011 | 3,991 | 7,863 | 10,249 | 10,047 | 11,821 | 10,510 | 9,847 | 9,602 | 7,845 | 7,848 | 8,428 | 10,083 |
| 2012 | 11,807 | 10,906 | 14,144 | 13,393 | 13,742 | 13,518 | 12,182 | 12,393 | 10,458 | 9,873 | 8,102 | 7,526 |
| 2013 | 5,899 | 2,995 | 6,834 | 9,959 | 11,285 | 9,802 | 10,245 | 9,414 | 9,013 | 9,196 | 7,374 | 3,510 |
| 2014 | 3,177 | 4,647 | 6,250 | 9,641 | 14,139 | 12,661 | 13,759 | 11,816 | 11,254 | 10,244 | 8,046 | 6,185 |
| 2015 | 7,063 | 6,518 | 12,889 | 15,257 | 20,229 | 19,250 | 20,746 | 19,196 | 17,297 | 15,658 | 14,451 | 16,212 |
| 2016 | 15,580 | 14,357 | 21,346 | 25,183 | 24,945 | 22,585 | 23,930 | 22,835 | 20,911 | 20,789 | 19,482 | 16,021 |
| 2017 | 16,416 | 19,311 | 25,145 | 24,714 | 25,940 | 24,360 | 24,866 | 24,876 | 21,276 | 23,181 | 23,703 | 23,145 |
| 2018 | 17,194 | 20,721 | 26,191 | 25,789 | 27,912 | 27,291 | 26,645 | 26,974 | 24,352 | 24,104 | 23,683 | 20,198 |
| 2019 | 20,545 | 21,306 | 26,233 | 26,711 | 25,684 | 24,808 | 22,831 | 24,311 | 25,909 | 26,155 | 20,102 | 17,865 |
| 2020 | 21,080 | 20,938 | 24,581 | 22,141 | 23,288 | 24,327 | 27,189 | 29,498 | 28,249 | 23,460 | 21,501 | 25,437 |
| 2021 | 24,138 | 19,909 | 26,321 | 33,442 | 31,583 | 30,934 | 31,344 | 29,227 | 28,679 | 30,494 | 27,578 | 28,973 |
| 2022 | -- | -- | -- | -- | -- | -- | -- | -- | -- | -- | -- | -- |
| 2023 | -- | -- | -- | -- | -- | -- | -- | -- | -- | -- | -- | -- |
| 2024 | -- | |||||||||||
| - = No Data Reported; -- = Not Applicable; NA = Not Available; W = Withheld to avoid disclosure of individual company data. |
| Release Date: 3/29/2024 |
| Next Release Date: 4/30/2024 |
Referring Pages: