|
Download Data (XLS File) |
|
||||||||
|
||||||||
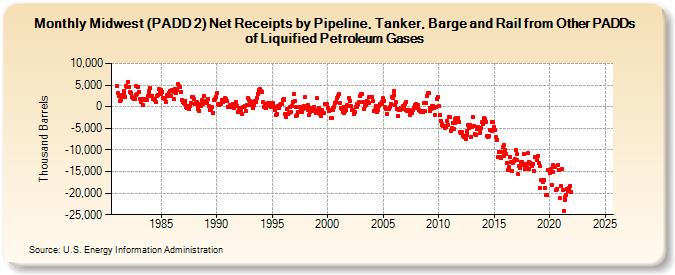
| Midwest (PADD 2) Net Receipts by Pipeline, Tanker, Barge and Rail from Other PADDs of Liquified Petroleum Gases (Thousand Barrels) | ||||||||
| Year | Jan | Feb | Mar | Apr | May | Jun | Jul | Aug | Sep | Oct | Nov | Dec |
|---|---|---|---|---|---|---|---|---|---|---|---|---|
| 1981 | 4,876 | 3,198 | 2,427 | 1,302 | 1,616 | 2,755 | 2,557 | 3,640 | 3,090 | 2,253 | 4,702 | 4,532 |
| 1982 | 5,735 | 4,603 | 3,325 | 3,053 | 2,218 | 2,098 | 1,756 | 1,857 | 2,610 | 4,712 | 3,009 | 4,617 |
| 1983 | 3,389 | 1,844 | 1,026 | 1,764 | 327 | 1,885 | 1,631 | 1,607 | 1,481 | 2,441 | 3,549 | 3,032 |
| 1984 | 4,333 | 2,541 | 2,496 | 1,810 | 1,668 | 1,589 | 1,084 | 2,570 | 2,639 | 4,054 | 3,705 | 2,948 |
| 1985 | 3,891 | 3,422 | 2,124 | 2,043 | 1,742 | 1,147 | 2,594 | 2,439 | 3,057 | 3,607 | 2,550 | 3,827 |
| 1986 | 3,577 | 1,677 | 3,395 | 4,171 | 3,130 | 3,788 | 5,141 | 4,702 | 4,517 | 3,393 | 1,466 | 975 |
| 1987 | 827 | 630 | 1,398 | 16 | -282 | 185 | -445 | 170 | 964 | 2,184 | 2,174 | 1,683 |
| 1988 | 673 | 853 | 1,027 | 229 | -451 | -884 | 669 | 209 | 1,538 | 533 | 2,434 | 1,050 |
| 1989 | 1,254 | 928 | 1,682 | 101 | 40 | -865 | -464 | -105 | -1,367 | 1,601 | 1,687 | 2,319 |
| 1990 | 3,088 | 665 | 379 | 593 | 727 | 1,499 | 1,099 | 1,019 | 1,563 | 1,902 | 1,881 | 1,292 |
| 1991 | 44 | -28 | 372 | -10 | 59 | 726 | 499 | -275 | 565 | 1,196 | 178 | -1,238 |
| 1992 | -288 | -438 | -753 | -1,787 | -97 | -81 | 231 | -909 | 397 | 390 | 1,923 | 1,640 |
| 1993 | 1,214 | 378 | 1,030 | -231 | 356 | 1,208 | 1,083 | 1,960 | 3,025 | 3,551 | 3,786 | 4,001 |
| 1994 | 3,700 | 3,487 | 1,013 | -44 | 605 | -314 | 46 | 871 | 648 | 873 | 11 | -37 |
| 1995 | 942 | 762 | 5 | -751 | -1,817 | -1,668 | 178 | -291 | 486 | 734 | 662 | 1,645 |
| 1996 | 1,729 | 1,455 | -1,639 | -2,416 | -496 | -1,593 | -1,575 | -97 | -1,224 | 96 | 1,151 | 2,920 |
| 1997 | 1,429 | -113 | -2,138 | -1,985 | -1,121 | -1,252 | -172 | -200 | -1,272 | -583 | 248 | 2,270 |
| 1998 | -254 | 7 | 381 | -718 | -1,976 | -1,127 | -295 | -1,100 | -434 | -62 | -698 | -1,355 |
| 1999 | 1,934 | -674 | -246 | -900 | -1,633 | -2,116 | -712 | -1,465 | -1,479 | 549 | 669 | 543 |
| 2000 | -275 | -1,102 | -660 | -2,622 | -2,708 | -827 | -372 | -42 | 930 | 1,041 | 2,087 | 2,567 |
| 2001 | 2,913 | 750 | -188 | -563 | -1,156 | -1,453 | -163 | -1,061 | -810 | 302 | 240 | 2,008 |
| 2002 | 1,334 | 148 | -879 | -802 | -1,642 | -1,271 | 9 | 28 | 662 | 559 | 1,037 | 2,449 |
| 2003 | 2,851 | 2,974 | 1,034 | -624 | 119 | 330 | 1,203 | 1,012 | 888 | 2,216 | 2,315 | 2,138 |
| 2004 | 2,271 | 1,246 | -1,092 | -719 | 271 | -1,155 | -812 | 268 | 577 | 642 | 688 | 1,031 |
| 2005 | 1,905 | 1,291 | -139 | -644 | -1,758 | -535 | -450 | -35 | 608 | 2,353 | 1,937 | 3,583 |
| 2006 | 2,747 | 312 | 1,068 | -451 | -2,098 | -863 | -740 | -296 | -585 | 250 | 184 | 645 |
| 2007 | -813 | 1,041 | -964 | -991 | -772 | -2,013 | -1,239 | -1,394 | -768 | -285 | 394 | 528 |
| 2008 | -242 | 387 | -8 | -880 | -928 | -1,167 | -1,069 | -1,284 | 771 | -1,059 | 824 | 2,524 |
| 2009 | 3,221 | 3,138 | -299 | -1,003 | -424 | 104 | 180 | -408 | -1,885 | -169 | 1,688 | 2,270 |
| 2010 | 226 | -1,889 | -3,220 | -3,958 | -4,224 | -4,483 | -4,366 | -4,828 | -4,619 | -3,348 | -4,141 | -2,388 |
| 2011 | -2,378 | -5,549 | -4,995 | -3,709 | -5,157 | -3,855 | -2,747 | -2,711 | -3,116 | -2,663 | -3,513 | -5,849 |
| 2012 | -6,050 | -5,771 | -6,897 | -7,054 | -6,712 | -7,573 | -5,687 | -6,524 | -4,351 | -4,950 | -4,341 | -6,975 |
| 2013 | -4,730 | -2,423 | -4,471 | -6,414 | -6,556 | -5,120 | -4,772 | -4,940 | -5,221 | -6,000 | -4,821 | -3,627 |
| 2014 | -4,054 | -2,724 | -2,844 | -3,435 | -6,833 | -6,919 | -6,878 | -5,364 | -5,336 | -5,669 | -3,450 | -3,601 |
| 2015 | -4,806 | -5,284 | -7,070 | -7,688 | -11,647 | -10,421 | -11,555 | -11,958 | -10,595 | -9,430 | -8,947 | -11,377 |
| 2016 | -9,978 | -10,998 | -13,007 | -14,700 | -14,045 | -11,573 | -12,707 | -14,801 | -13,006 | -12,549 | -12,182 | -10,087 |
| 2017 | -11,048 | -12,353 | -15,664 | -13,700 | -14,155 | -12,802 | -12,863 | -13,457 | -11,062 | -14,358 | -13,211 | -14,033 |
| 2018 | -10,804 | -12,795 | -14,320 | -12,958 | -13,181 | -13,648 | -13,237 | -14,794 | -11,647 | -11,679 | -12,351 | -11,323 |
| 2019 | -13,061 | -13,705 | -18,922 | -16,883 | -17,004 | -17,343 | -17,048 | -18,832 | -20,519 | -20,444 | -14,669 | -14,586 |
| 2020 | -15,293 | -14,531 | -18,038 | -15,072 | -13,471 | -13,820 | -13,981 | -19,371 | -19,087 | -13,542 | -14,734 | -21,144 |
| 2021 | -18,343 | -14,533 | -19,178 | -24,084 | -21,659 | -20,991 | -20,464 | -19,004 | -19,579 | -18,707 | -18,343 | -19,815 |
| 2022 | -- | -- | -- | -- | -- | -- | -- | -- | -- | -- | -- | -- |
| 2023 | -- | -- | -- | -- | -- | -- | -- | -- | -- | -- | -- | -- |
| 2024 | -- | -- | -- | -- | -- | -- | -- | -- | -- | -- | -- | -- |
| 2025 | -- | -- | -- | -- | ||||||||
| - = No Data Reported; -- = Not Applicable; NA = Not Available; W = Withheld to avoid disclosure of individual company data. |
| Release Date: 6/30/2025 |
| Next Release Date: 7/31/2025 |
Referring Pages: