|
Download Data (XLS File) |
|
||||||||
|
||||||||
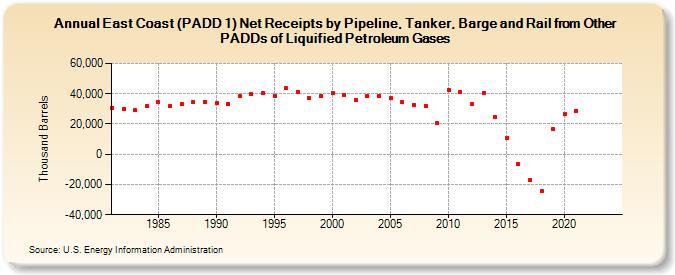
| East Coast (PADD 1) Net Receipts by Pipeline, Tanker, Barge and Rail from Other PADDs of Liquified Petroleum Gases (Thousand Barrels) | ||||||||
| Decade | Year-0 | Year-1 | Year-2 | Year-3 | Year-4 | Year-5 | Year-6 | Year-7 | Year-8 | Year-9 |
|---|---|---|---|---|---|---|---|---|---|---|
| 1980's | 30,437 | 30,071 | 29,061 | 31,757 | 34,418 | 32,138 | 33,072 | 34,261 | 34,690 | |
| 1990's | 33,980 | 33,371 | 38,524 | 39,712 | 40,199 | 38,756 | 43,737 | 41,435 | 37,047 | 38,532 |
| 2000's | 40,472 | 39,182 | 35,871 | 38,409 | 38,359 | 36,994 | 34,435 | 32,846 | 32,207 | 20,384 |
| 2010's | 42,537 | 40,969 | 33,013 | 40,531 | 24,319 | 10,932 | -6,526 | -16,944 | -24,449 | 16,430 |
| 2020's | 26,360 | 28,687 | -- | -- | -- |
| - = No Data Reported; -- = Not Applicable; NA = Not Available; W = Withheld to avoid disclosure of individual company data. |
| Release Date: 6/30/2025 |
| Next Release Date: 8/29/2025 |
Referring Pages: