|
Download Data (XLS File) |
|
||||||||
|
||||||||
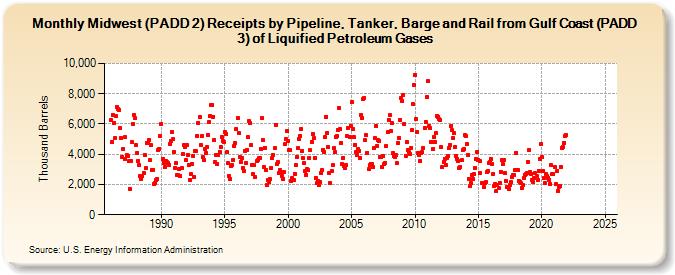
| Midwest (PADD 2) Receipts by Pipeline, Tanker, Barge and Rail from Gulf Coast (PADD 3) of Liquified Petroleum Gases (Thousand Barrels) | ||||||||
| Year | Jan | Feb | Mar | Apr | May | Jun | Jul | Aug | Sep | Oct | Nov | Dec |
|---|---|---|---|---|---|---|---|---|---|---|---|---|
| 1986 | 6,238 | 4,801 | 6,623 | 6,052 | 5,059 | 6,541 | 7,135 | 6,991 | 6,948 | 5,726 | 5,072 | 3,849 |
| 1987 | 4,354 | 3,691 | 5,132 | 3,928 | 3,859 | 3,548 | 1,723 | 3,576 | 4,789 | 6,014 | 6,607 | 6,375 |
| 1988 | 4,623 | 4,111 | 3,582 | 3,258 | 2,555 | 2,338 | 2,534 | 2,766 | 3,974 | 3,066 | 4,758 | 4,770 |
| 1989 | 4,925 | 3,609 | 4,593 | 2,961 | 2,980 | 2,020 | 2,094 | 2,292 | 2,384 | 4,250 | 4,361 | 5,221 |
| 1990 | 6,026 | 3,682 | 3,427 | 3,125 | 3,569 | 3,480 | 3,431 | 3,316 | 4,686 | 4,894 | 5,441 | 4,983 |
| 1991 | 4,154 | 3,118 | 3,392 | 2,624 | 2,594 | 2,995 | 2,576 | 3,085 | 4,011 | 4,605 | 4,447 | 3,617 |
| 1992 | 4,609 | 3,962 | 3,308 | 2,320 | 2,666 | 3,385 | 3,911 | 2,509 | 4,243 | 4,180 | 5,236 | 6,087 |
| 1993 | 6,481 | 4,595 | 5,178 | 3,784 | 3,616 | 4,350 | 4,107 | 4,456 | 5,258 | 6,141 | 6,523 | 7,268 |
| 1994 | 7,275 | 6,494 | 4,935 | 3,477 | 3,933 | 3,331 | 3,962 | 4,177 | 4,450 | 5,152 | 4,897 | 4,794 |
| 1995 | 5,473 | 5,367 | 4,125 | 3,410 | 2,545 | 2,347 | 3,203 | 3,296 | 3,634 | 4,517 | 4,731 | 5,672 |
| 1996 | 6,390 | 5,415 | 3,806 | 3,507 | 3,761 | 3,111 | 2,874 | 4,241 | 3,424 | 4,274 | 5,106 | 6,177 |
| 1997 | 6,049 | 4,629 | 3,280 | 2,685 | 3,280 | 2,489 | 3,534 | 3,603 | 3,730 | 3,745 | 4,352 | 6,409 |
| 1998 | 4,920 | 3,136 | 4,443 | 2,956 | 1,964 | 2,287 | 2,163 | 2,333 | 3,119 | 3,782 | 3,956 | 4,379 |
| 1999 | 5,955 | 3,332 | 3,465 | 2,730 | 2,961 | 2,812 | 2,583 | 2,390 | 2,798 | 4,643 | 4,987 | 5,506 |
| 2000 | 4,851 | 4,285 | 4,253 | 2,246 | 2,422 | 2,328 | 2,704 | 3,258 | 3,790 | 4,384 | 4,994 | 5,221 |
| 2001 | 5,664 | 4,218 | 3,759 | 3,415 | 2,872 | 2,614 | 3,037 | 2,972 | 3,749 | 4,247 | 4,832 | 5,340 |
| 2002 | 5,052 | 3,771 | 2,435 | 2,095 | 2,245 | 1,962 | 2,140 | 2,739 | 2,926 | 4,285 | 4,132 | 5,132 |
| 2003 | 6,489 | 5,425 | 4,449 | 2,740 | 2,087 | 2,906 | 3,268 | 4,408 | 4,153 | 5,168 | 5,192 | 5,611 |
| 2004 | 7,088 | 5,681 | 4,715 | 3,352 | 3,782 | 3,225 | 3,121 | 3,299 | 5,172 | 5,753 | 5,111 | 5,882 |
| 2005 | 7,439 | 5,670 | 5,149 | 4,613 | 4,134 | 3,941 | 4,314 | 4,242 | 3,781 | 6,617 | 6,411 | 7,641 |
| 2006 | 7,734 | 4,920 | 5,238 | 4,101 | 3,018 | 3,262 | 3,363 | 3,333 | 3,135 | 4,408 | 5,040 | 5,850 |
| 2007 | 4,529 | 4,930 | 4,890 | 3,847 | 3,803 | 3,132 | 3,864 | 3,381 | 3,446 | 4,517 | 5,467 | 6,284 |
| 2008 | 6,585 | 5,503 | 6,037 | 4,074 | 3,879 | 3,785 | 3,928 | 3,397 | 4,745 | 5,077 | 6,285 | 7,726 |
| 2009 | 7,528 | 7,916 | 5,998 | 3,907 | 4,782 | 4,272 | 4,128 | 4,035 | 4,425 | 5,573 | 7,348 | 8,599 |
| 2010 | 9,260 | 6,302 | 5,447 | 4,092 | 3,970 | 3,553 | 4,089 | 4,124 | 4,424 | 5,739 | 6,162 | 7,758 |
| 2011 | 8,823 | 5,853 | 5,713 | 4,805 | 4,793 | 4,358 | 5,144 | 4,798 | 5,391 | 6,552 | 6,469 | 6,304 |
| 2012 | 6,257 | 4,457 | 3,154 | 3,492 | 3,696 | 3,288 | 3,767 | 3,862 | 4,387 | 4,628 | 5,865 | 5,596 |
| 2013 | 5,077 | 5,399 | 4,463 | 3,870 | 3,703 | 3,553 | 3,064 | 3,174 | 3,597 | 4,253 | 4,314 | 5,256 |
| 2014 | 5,176 | 4,643 | 3,951 | 2,394 | 1,873 | 2,079 | 2,652 | 2,348 | 2,667 | 3,092 | 3,699 | 4,163 |
| 2015 | 3,637 | 3,519 | 2,763 | 2,091 | 2,113 | 1,825 | 2,118 | 2,186 | 2,797 | 2,902 | 3,452 | 3,506 |
| 2016 | 3,693 | 3,365 | 2,712 | 1,915 | 2,060 | 1,584 | 1,985 | 1,771 | 2,129 | 2,830 | 3,617 | 3,339 |
| 2017 | 3,645 | 2,764 | 2,258 | 1,859 | 1,863 | 1,697 | 1,937 | 2,176 | 2,478 | 2,656 | 2,616 | 2,924 |
| 2018 | 4,108 | 2,962 | 2,251 | 2,182 | 2,069 | 1,788 | 1,970 | 2,458 | 2,656 | 2,686 | 2,769 | 3,518 |
| 2019 | 4,292 | 2,814 | 2,709 | 2,328 | 2,148 | 2,440 | 2,741 | 2,551 | 2,280 | 2,912 | 3,691 | 4,647 |
| 2020 | 3,786 | 2,919 | 2,412 | 2,065 | 2,720 | 2,581 | 2,439 | 2,303 | 2,002 | 3,255 | 2,665 | 2,693 |
| 2021 | 3,178 | 2,003 | 2,870 | 1,583 | 1,851 | 1,916 | 3,165 | 4,422 | 4,493 | 4,774 | 5,214 | 5,255 |
| 2022 | -- | -- | -- | -- | -- | -- | -- | -- | -- | -- | -- | -- |
| 2023 | -- | -- | -- | -- | -- | -- | -- | -- | -- | -- | -- | -- |
| 2024 | -- | |||||||||||
| - = No Data Reported; -- = Not Applicable; NA = Not Available; W = Withheld to avoid disclosure of individual company data. |
| Release Date: 3/29/2024 |
| Next Release Date: 4/30/2024 |