|
Download Data (XLS File) |
|
||||||||
|
||||||||
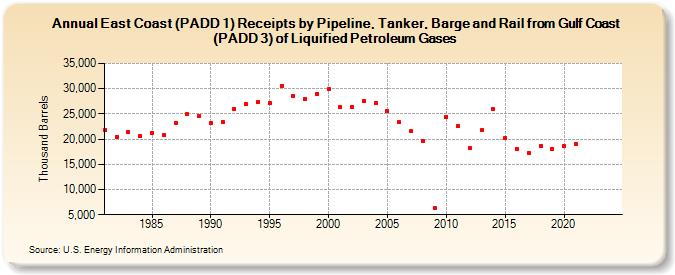
| East Coast (PADD 1) Receipts by Pipeline, Tanker, Barge and Rail from Gulf Coast (PADD 3) of Liquified Petroleum Gases (Thousand Barrels) | ||||||||
| Decade | Year-0 | Year-1 | Year-2 | Year-3 | Year-4 | Year-5 | Year-6 | Year-7 | Year-8 | Year-9 |
|---|---|---|---|---|---|---|---|---|---|---|
| 1980's | 21,769 | 20,514 | 21,317 | 20,556 | 21,153 | 20,796 | 23,221 | 24,910 | 24,611 | |
| 1990's | 23,195 | 23,396 | 26,051 | 26,957 | 27,384 | 27,168 | 30,624 | 28,622 | 27,959 | 28,932 |
| 2000's | 29,926 | 26,337 | 26,286 | 27,519 | 27,131 | 25,617 | 23,359 | 21,553 | 19,690 | 6,372 |
| 2010's | 24,441 | 22,578 | 18,191 | 21,797 | 25,880 | 20,253 | 18,029 | 17,337 | 18,649 | 18,123 |
| 2020's | 18,561 | 19,092 | -- | -- |
| - = No Data Reported; -- = Not Applicable; NA = Not Available; W = Withheld to avoid disclosure of individual company data. |
| Release Date: 3/29/2024 |
| Next Release Date: 8/30/2024 |