|
Download Data (XLS File) |
|
||||||||
|
||||||||
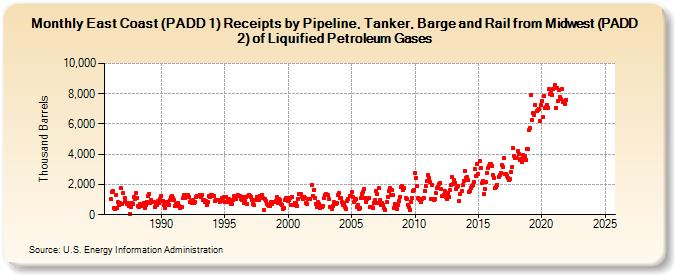
| East Coast (PADD 1) Receipts by Pipeline, Tanker, Barge and Rail from Midwest (PADD 2) of Liquified Petroleum Gases (Thousand Barrels) | ||||||||
| Year | Jan | Feb | Mar | Apr | May | Jun | Jul | Aug | Sep | Oct | Nov | Dec |
|---|---|---|---|---|---|---|---|---|---|---|---|---|
| 1986 | 1,038 | 1,483 | 1,570 | 460 | 350 | 1,325 | 474 | 815 | 623 | 778 | 1,750 | 676 |
| 1987 | 1,428 | 1,131 | 871 | 730 | 778 | 583 | 69 | 505 | 783 | 736 | 1,194 | 1,043 |
| 1988 | 1,437 | 1,124 | 578 | 501 | 682 | 577 | 558 | 745 | 475 | 610 | 851 | 1,222 |
| 1989 | 1,388 | 792 | 968 | 823 | 845 | 813 | 485 | 646 | 616 | 894 | 794 | 1,015 |
| 1990 | 1,224 | 928 | 644 | 436 | 849 | 719 | 866 | 661 | 961 | 1,160 | 1,267 | 1,120 |
| 1991 | 947 | 566 | 707 | 701 | 775 | 600 | 421 | 493 | 1,093 | 1,283 | 1,133 | 1,256 |
| 1992 | 1,308 | 1,273 | 1,167 | 850 | 906 | 783 | 953 | 746 | 833 | 1,193 | 1,249 | 1,213 |
| 1993 | 1,279 | 1,188 | 1,323 | 998 | 967 | 846 | 910 | 664 | 847 | 1,224 | 1,198 | 1,311 |
| 1994 | 1,288 | 1,227 | 1,253 | 918 | 996 | 973 | 998 | 857 | 933 | 1,095 | 1,130 | 1,147 |
| 1995 | 856 | 1,196 | 870 | 989 | 1,014 | 852 | 690 | 703 | 943 | 1,225 | 1,200 | 1,050 |
| 1996 | 1,300 | 1,249 | 1,211 | 1,072 | 980 | 1,188 | 786 | 894 | 1,177 | 736 | 1,251 | 1,319 |
| 1997 | 1,257 | 1,196 | 949 | 681 | 636 | 973 | 1,170 | 1,193 | 965 | 1,254 | 1,254 | 1,325 |
| 1998 | 1,093 | 342 | 1,025 | 917 | 676 | 652 | 557 | 551 | 828 | 736 | 872 | 839 |
| 1999 | 890 | 1,184 | 763 | 1,061 | 946 | 683 | 661 | 397 | 452 | 964 | 1,087 | 1,074 |
| 2000 | 921 | 945 | 1,105 | 625 | 1,175 | 643 | 779 | 776 | 601 | 1,066 | 1,351 | 1,370 |
| 2001 | 1,357 | 1,150 | 1,012 | 1,202 | 1,106 | 798 | 739 | 1,061 | 1,052 | 1,028 | 1,975 | 1,240 |
| 2002 | 1,628 | 1,107 | 738 | 536 | 840 | 731 | 446 | 560 | 487 | 595 | 1,078 | 1,285 |
| 2003 | 1,371 | 1,278 | 1,279 | 1,054 | 535 | 409 | 576 | 862 | 771 | 697 | 793 | 1,284 |
| 2004 | 1,414 | 1,124 | 1,138 | 812 | 672 | 762 | 483 | 398 | 924 | 1,046 | 1,213 | 1,242 |
| 2005 | 1,488 | 1,152 | 835 | 946 | 1,054 | 539 | 659 | 376 | 461 | 1,114 | 1,370 | 1,528 |
| 2006 | 1,716 | 1,119 | 813 | 1,019 | 1,078 | 511 | 523 | 487 | 474 | 778 | 978 | 1,580 |
| 2007 | 1,346 | 799 | 1,739 | 974 | 633 | 775 | 628 | 426 | 337 | 852 | 1,203 | 1,581 |
| 2008 | 1,747 | 1,271 | 1,630 | 1,316 | 418 | 711 | 499 | 350 | 640 | 938 | 1,184 | 1,813 |
| 2009 | 1,906 | 1,636 | 1,742 | 1,096 | 1,022 | 655 | 490 | 284 | 859 | 1,096 | 1,564 | 1,662 |
| 2010 | 2,762 | 2,445 | 1,875 | 1,138 | 1,053 | 950 | 842 | 1,038 | 1,125 | 1,600 | 1,915 | 2,226 |
| 2011 | 2,626 | 2,437 | 2,162 | 1,062 | 1,972 | 1,015 | 956 | 1,018 | 1,403 | 1,745 | 1,816 | 2,030 |
| 2012 | 2,074 | 1,692 | 1,253 | 1,331 | 1,571 | 1,140 | 1,019 | 1,417 | 1,184 | 1,605 | 1,932 | 2,483 |
| 2013 | 2,022 | 2,264 | 2,116 | 1,703 | 1,855 | 1,897 | 927 | 1,388 | 1,549 | 1,935 | 2,248 | 2,892 |
| 2014 | 2,458 | 2,487 | 2,318 | 1,532 | 1,558 | 1,755 | 1,911 | 1,997 | 2,163 | 3,013 | 2,586 | 3,335 |
| 2015 | 2,671 | 3,538 | 3,121 | 2,070 | 2,232 | 1,399 | 1,688 | 2,133 | 2,760 | 3,109 | 3,249 | 3,360 |
| 2016 | 3,337 | 3,200 | 2,602 | 2,457 | 1,796 | 1,838 | 1,986 | 2,498 | 2,627 | 2,785 | 3,287 | 3,151 |
| 2017 | 3,748 | 2,712 | 2,710 | 2,574 | 2,445 | 2,280 | 2,386 | 2,837 | 3,146 | 4,393 | 3,853 | 3,733 |
| 2018 | 3,725 | 4,180 | 4,032 | 3,620 | 3,674 | 3,464 | 3,963 | 3,752 | 3,850 | 3,632 | 4,373 | 4,374 |
| 2019 | 5,586 | 5,702 | 7,900 | 6,231 | 6,700 | 6,625 | 7,267 | 6,850 | 6,891 | 6,994 | 6,187 | 7,262 |
| 2020 | 7,503 | 6,452 | 7,877 | 7,062 | 7,094 | 7,277 | 7,088 | 8,291 | 7,949 | 8,074 | 7,913 | 8,288 |
| 2021 | 8,573 | 7,048 | 8,351 | 7,488 | 8,247 | 7,797 | 7,677 | 8,293 | 7,475 | 7,523 | 7,312 | 7,616 |
| 2022 | -- | -- | -- | -- | -- | -- | -- | -- | -- | -- | -- | -- |
| 2023 | -- | -- | -- | -- | -- | -- | -- | -- | -- | -- | -- | -- |
| 2024 | -- | |||||||||||
| - = No Data Reported; -- = Not Applicable; NA = Not Available; W = Withheld to avoid disclosure of individual company data. |
| Release Date: 3/29/2024 |
| Next Release Date: 4/30/2024 |