|
Download Data (XLS File) |
|
||||||||
|
||||||||
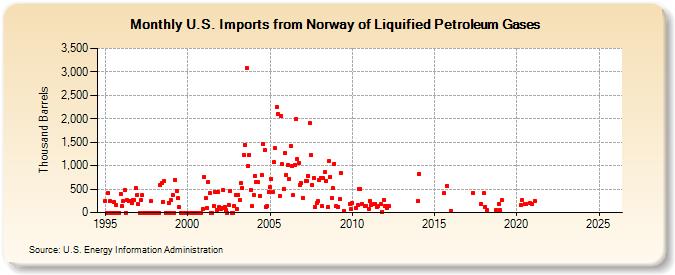
| U.S. Imports from Norway of Liquified Petroleum Gases (Thousand Barrels) | ||||||||
| Year | Jan | Feb | Mar | Apr | May | Jun | Jul | Aug | Sep | Oct | Nov | Dec |
|---|---|---|---|---|---|---|---|---|---|---|---|---|
| 1995 | 248 | 0 | 408 | 236 | 0 | 0 | 225 | 0 | 153 | 0 | 0 | 397 |
| 1996 | 150 | 247 | 482 | 0 | 260 | 248 | 248 | 198 | 263 | 261 | 526 | 379 |
| 1997 | 181 | 0 | 264 | 374 | 0 | 0 | 0 | 0 | 0 | 239 | 0 | 0 |
| 1998 | 0 | 0 | 0 | 0 | 579 | 624 | 235 | 663 | 0 | 0 | 212 | 0 |
| 1999 | 261 | 376 | 0 | 704 | 468 | 304 | 118 | 0 | 0 | 0 | 0 | 0 |
| 2000 | 0 | 0 | 0 | 0 | 0 | 0 | 0 | 0 | 0 | 0 | 0 | 84 |
| 2001 | 764 | 300 | 107 | 655 | 422 | 0 | 0 | 142 | 444 | 56 | 428 | 115 |
| 2002 | 78 | 107 | 474 | 115 | 47 | 0 | 168 | 467 | 0 | 0 | 145 | 370 |
| 2003 | 66 | 371 | 261 | 631 | 531 | 1,219 | 1,448 | 3,081 | 1,003 | 1,233 | 483 | 130 |
| 2004 | 381 | 786 | 662 | 655 | 355 | 811 | 1,466 | 1,337 | 124 | 133 | 439 | |
| 2005 | 535 | 714 | 438 | 1,070 | 1,366 | 2,255 | 2,099 | 362 | 2,068 | 1,027 | 509 | 1,263 |
| 2006 | 809 | 1,014 | 720 | 1,424 | 998 | 367 | 1,009 | 1,988 | 1,139 | 1,059 | 593 | 621 |
| 2007 | 319 | 676 | 672 | 790 | 1,908 | 1,225 | 589 | 740 | 116 | 209 | 236 | |
| 2008 | 704 | 739 | 133 | 727 | 858 | 677 | 117 | 1,094 | 767 | 321 | 517 | 1,041 |
| 2009 | 132 | 129 | 282 | 846 | 41 | 184 | 72 | |||||
| 2010 | 209 | 96 | 154 | 499 | 502 | 187 | 146 | 136 | ||||
| 2011 | 79 | 242 | 171 | 175 | 190 | 126 | 139 | 173 | 19 | 272 | ||
| 2012 | 139 | 101 | 145 | 131 | ||||||||
| 2014 | 247 | 832 | ||||||||||
| 2015 | 411 | 573 | ||||||||||
| 2016 | 43 | |||||||||||
| 2017 | 419 | 177 | ||||||||||
| 2018 | 411 | 129 | 55 | 56 | 192 | |||||||
| 2019 | 47 | 262 | ||||||||||
| 2020 | 151 | 265 | 192 | 186 | 198 | 191 | ||||||
| 2021 | 253 | |||||||||||
| 2022 | -- | |||||||||||
| - = No Data Reported; -- = Not Applicable; NA = Not Available; W = Withheld to avoid disclosure of individual company data. |
| Release Date: 3/29/2024 |
| Next Release Date: 4/30/2024 |