|
Download Data (XLS File) |
|
||||||||
|
||||||||
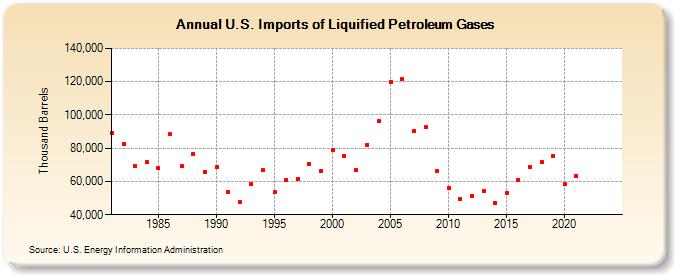
| U.S. Imports of Liquified Petroleum Gases (Thousand Barrels) | ||||||||
| Decade | Year-0 | Year-1 | Year-2 | Year-3 | Year-4 | Year-5 | Year-6 | Year-7 | Year-8 | Year-9 |
|---|---|---|---|---|---|---|---|---|---|---|
| 1980's | 89,015 | 82,311 | 69,419 | 71,411 | 68,091 | 88,291 | 69,339 | 76,638 | 65,904 | |
| 1990's | 68,471 | 53,673 | 47,776 | 58,227 | 66,682 | 53,373 | 60,730 | 61,702 | 70,663 | 66,298 |
| 2000's | 78,649 | 75,094 | 66,617 | 82,185 | 96,181 | 119,655 | 121,296 | 90,299 | 92,558 | 66,490 |
| 2010's | 55,816 | 49,170 | 51,512 | 54,049 | 46,845 | 52,780 | 60,995 | 68,687 | 71,893 | 75,378 |
| 2020's | 58,312 | 63,175 | -- | -- |
| - = No Data Reported; -- = Not Applicable; NA = Not Available; W = Withheld to avoid disclosure of individual company data. |
| Release Date: 3/29/2024 |
| Next Release Date: 8/30/2024 |