|
Download Data (XLS File) |
|
||||||||
|
||||||||
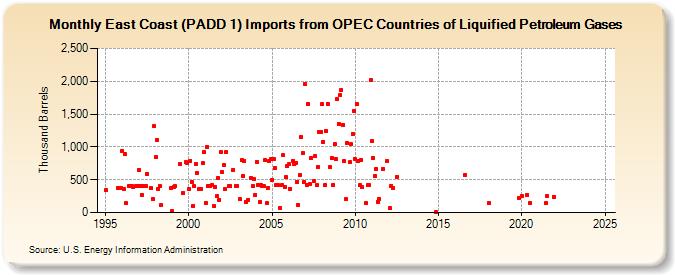
| East Coast (PADD 1) Imports from OPEC Countries of Liquified Petroleum Gases (Thousand Barrels) | ||||||||
| Year | Jan | Feb | Mar | Apr | May | Jun | Jul | Aug | Sep | Oct | Nov | Dec |
|---|---|---|---|---|---|---|---|---|---|---|---|---|
| 1995 | 336 | 367 | 368 | |||||||||
| 1996 | 943 | 354 | 891 | 138 | 400 | 401 | 386 | 400 | 400 | |||
| 1997 | 651 | 400 | 275 | 398 | 400 | 584 | 369 | 210 | 1,311 | |||
| 1998 | 845 | 1,109 | 365 | 400 | 111 | 368 | ||||||
| 1999 | 20 | 393 | 399 | 741 | 298 | 763 | 752 | |||||
| 2000 | 354 | 790 | 462 | 106 | 397 | 743 | 603 | 354 | 365 | 753 | 920 | |
| 2001 | 153 | 999 | 400 | 398 | 420 | 106 | 391 | 248 | 524 | 197 | 921 | |
| 2002 | 617 | 721 | 353 | 923 | 398 | 399 | 649 | 398 | 399 | |||
| 2003 | 200 | 799 | 561 | 787 | 166 | 193 | 525 | 399 | 511 | |||
| 2004 | 270 | 773 | 415 | 158 | 418 | 398 | 399 | 798 | 142 | 373 | 788 | 814 |
| 2005 | 502 | 815 | 679 | 414 | 413 | 63 | 415 | 871 | 394 | 536 | 704 | |
| 2006 | 733 | 366 | 790 | 740 | 762 | 470 | 117 | 574 | 1,149 | 906 | 467 | |
| 2007 | 1,959 | 414 | 1,655 | 434 | 831 | 478 | 854 | 414 | 694 | 1,231 | 1,227 | |
| 2008 | 1,649 | 1,076 | 415 | 1,242 | 1,654 | 689 | 829 | 416 | 1,043 | 819 | 1,725 | |
| 2009 | 1,347 | 1,788 | 1,865 | 1,338 | 783 | 202 | 1,052 | 764 | 1,037 | 1,203 | 1,551 | |
| 2010 | 813 | 1,656 | 789 | 415 | 805 | 388 | 142 | 416 | 414 | 2,013 | ||
| 2011 | 1,083 | 829 | 555 | 664 | 165 | 214 | 662 | 784 | ||||
| 2012 | 63 | 412 | 373 | 548 | ||||||||
| 2014 | 13 | |||||||||||
| 2016 | 577 | |||||||||||
| 2018 | 140 | |||||||||||
| 2019 | 224 | |||||||||||
| 2020 | 259 | 264 | 149 | |||||||||
| 2021 | 144 | 245 | 243 | |||||||||
| 2022 | -- | -- | -- | |||||||||
| 2023 | -- | -- | -- | -- | -- | -- | ||||||
| - = No Data Reported; -- = Not Applicable; NA = Not Available; W = Withheld to avoid disclosure of individual company data. |
| Release Date: 3/29/2024 |
| Next Release Date: 4/30/2024 |