|
Download Data (XLS File) |
|
||||||||
|
||||||||
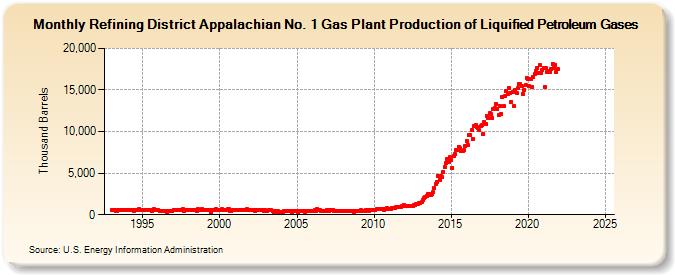
| Refining District Appalachian No. 1 Gas Plant Production of Liquified Petroleum Gases (Thousand Barrels) | ||||||||
| Year | Jan | Feb | Mar | Apr | May | Jun | Jul | Aug | Sep | Oct | Nov | Dec |
|---|---|---|---|---|---|---|---|---|---|---|---|---|
| 1993 | 613 | 549 | 583 | 462 | 452 | 574 | 554 | 591 | 582 | 626 | 609 | 599 |
| 1994 | 528 | 551 | 599 | 567 | 547 | 494 | 591 | 518 | 626 | 650 | 618 | 572 |
| 1995 | 601 | 530 | 620 | 597 | 594 | 607 | 571 | 422 | 594 | 634 | 614 | 587 |
| 1996 | 547 | 420 | 461 | 472 | 428 | 417 | 441 | 186 | 478 | 494 | 479 | 489 |
| 1997 | 567 | 534 | 617 | 590 | 527 | 590 | 607 | 628 | 506 | 624 | 612 | 591 |
| 1998 | 621 | 570 | 616 | 571 | 585 | 592 | 434 | 635 | 590 | 617 | 668 | 617 |
| 1999 | 594 | 558 | 604 | 600 | 588 | 266 | 593 | 613 | 593 | 649 | 625 | 611 |
| 2000 | 607 | 570 | 645 | 622 | 626 | 608 | 642 | 645 | 474 | 438 | 604 | 591 |
| 2001 | 561 | 526 | 625 | 591 | 575 | 608 | 627 | 624 | 610 | 646 | 623 | 619 |
| 2002 | 583 | 534 | 553 | 502 | 539 | 512 | 579 | 569 | 529 | 562 | 490 | 568 |
| 2003 | 402 | 462 | 545 | 520 | 561 | 443 | 234 | 260 | 403 | 449 | 272 | 286 |
| 2004 | 278 | 357 | 417 | 446 | 437 | 443 | 417 | 457 | 325 | 480 | 450 | 453 |
| 2005 | 423 | 310 | 431 | 391 | 427 | 416 | 340 | 437 | 433 | 436 | 414 | 437 |
| 2006 | 457 | 474 | 532 | 494 | 650 | 589 | 574 | 482 | 482 | 438 | 504 | 510 |
| 2007 | 505 | 492 | 536 | 533 | 535 | 478 | 458 | 432 | 476 | 481 | 484 | 490 |
| 2008 | 472 | 451 | 476 | 431 | 486 | 463 | 491 | 485 | 381 | 501 | 490 | 496 |
| 2009 | 482 | 442 | 512 | 493 | 493 | 483 | 527 | 539 | 489 | 560 | 534 | 541 |
| 2010 | 620 | 570 | 686 | 643 | 676 | 679 | 710 | 699 | 561 | 656 | 789 | 746 |
| 2011 | 746 | 741 | 830 | 829 | 867 | 876 | 939 | 918 | 902 | 943 | 992 | 1,115 |
| 2012 | 1,101 | 1,013 | 1,052 | 1,018 | 1,078 | 1,083 | 1,030 | 1,161 | 1,161 | 1,233 | 1,342 | 1,448 |
| 2013 | 1,457 | 1,487 | 1,722 | 1,952 | 2,151 | 2,306 | 2,466 | 2,437 | 2,338 | 2,475 | 2,688 | 3,208 |
| 2014 | 3,704 | 3,984 | 4,673 | 4,233 | 4,597 | 4,529 | 5,192 | 5,790 | 6,172 | 6,698 | 6,327 | 6,885 |
| 2015 | 6,546 | 5,620 | 7,043 | 7,290 | 7,831 | 7,728 | 8,176 | 7,983 | 7,636 | 7,712 | 7,723 | 8,262 |
| 2016 | 8,819 | 8,441 | 9,539 | 9,574 | 10,167 | 9,110 | 10,610 | 10,778 | 10,497 | 10,425 | 10,146 | 10,630 |
| 2017 | 10,755 | 9,674 | 11,162 | 10,968 | 11,909 | 11,646 | 12,202 | 12,065 | 11,649 | 12,676 | 12,799 | 13,300 |
| 2018 | 12,763 | 11,959 | 13,114 | 12,127 | 14,167 | 13,093 | 14,292 | 14,845 | 14,547 | 15,276 | 14,695 | 13,575 |
| 2019 | 14,768 | 13,032 | 15,014 | 14,674 | 15,177 | 15,665 | 15,675 | 15,483 | 14,511 | 15,052 | 15,554 | 16,470 |
| 2020 | 16,379 | 15,431 | 16,372 | 15,356 | 16,570 | 16,875 | 17,254 | 17,664 | 17,008 | 17,994 | 17,077 | 17,446 |
| 2021 | 17,696 | 15,392 | 17,592 | 17,208 | 17,295 | 17,163 | 17,518 | 18,167 | 17,687 | 18,048 | 17,191 | 17,545 |
| 2022 | -- | -- | -- | -- | -- | -- | -- | -- | -- | -- | -- | -- |
| 2023 | -- | -- | -- | -- | -- | -- | -- | -- | -- | -- | -- | -- |
| 2024 | -- | |||||||||||
| - = No Data Reported; -- = Not Applicable; NA = Not Available; W = Withheld to avoid disclosure of individual company data. |
| Release Date: 3/29/2024 |
| Next Release Date: 4/30/2024 |