|
Download Data (XLS File) |
|
||||||||
|
||||||||
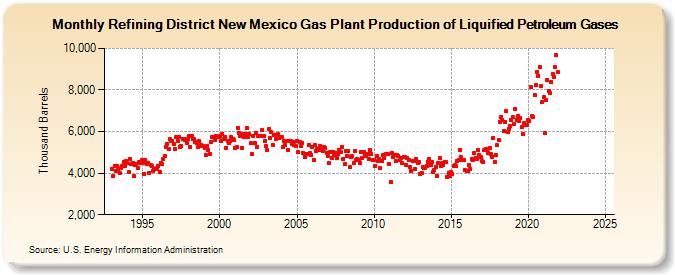
| Refining District New Mexico Gas Plant Production of Liquified Petroleum Gases (Thousand Barrels) | ||||||||
| Year | Jan | Feb | Mar | Apr | May | Jun | Jul | Aug | Sep | Oct | Nov | Dec |
|---|---|---|---|---|---|---|---|---|---|---|---|---|
| 1993 | 4,218 | 3,865 | 4,356 | 4,105 | 4,366 | 4,140 | 3,994 | 4,263 | 4,323 | 4,556 | 4,358 | 4,562 |
| 1994 | 4,464 | 4,066 | 4,700 | 4,440 | 4,480 | 3,848 | 4,405 | 4,444 | 4,249 | 4,513 | 4,466 | 4,642 |
| 1995 | 4,505 | 3,970 | 4,614 | 4,459 | 4,503 | 4,029 | 4,392 | 4,323 | 4,109 | 4,212 | 4,220 | 4,223 |
| 1996 | 4,340 | 4,078 | 4,477 | 4,452 | 4,699 | 4,816 | 5,242 | 5,382 | 5,148 | 5,619 | 5,523 | 5,550 |
| 1997 | 5,391 | 5,149 | 5,723 | 5,565 | 5,753 | 5,263 | 5,316 | 5,647 | 5,664 | 5,589 | 5,472 | 5,641 |
| 1998 | 5,778 | 5,266 | 5,794 | 5,636 | 5,641 | 5,487 | 5,433 | 5,259 | 5,526 | 5,356 | 5,317 | 5,297 |
| 1999 | 5,230 | 4,855 | 5,316 | 5,089 | 4,937 | 5,503 | 5,717 | 5,723 | 5,614 | 5,765 | 5,723 | 5,755 |
| 2000 | 5,799 | 5,527 | 5,904 | 5,640 | 5,761 | 5,209 | 5,565 | 5,470 | 5,524 | 5,734 | 5,637 | 5,600 |
| 2001 | 5,194 | 5,250 | 6,191 | 5,949 | 5,779 | 5,217 | 5,886 | 5,759 | 5,874 | 6,165 | 5,751 | 5,876 |
| 2002 | 5,444 | 4,929 | 5,777 | 5,427 | 5,922 | 5,270 | 5,763 | 5,787 | 5,769 | 6,071 | 5,784 | 5,551 |
| 2003 | 5,304 | 5,112 | 6,130 | 5,695 | 5,961 | 5,355 | 5,831 | 5,830 | 5,649 | 5,865 | 5,671 | 5,723 |
| 2004 | 5,721 | 5,261 | 5,562 | 5,355 | 5,551 | 5,124 | 5,555 | 5,522 | 5,397 | 5,490 | 5,344 | 5,294 |
| 2005 | 5,535 | 4,994 | 5,512 | 5,302 | 5,460 | 4,945 | 4,794 | 4,933 | 4,927 | 5,367 | 4,966 | 4,871 |
| 2006 | 5,267 | 4,642 | 5,341 | 5,058 | 5,147 | 5,119 | 5,305 | 5,127 | 5,070 | 5,254 | 5,211 | 4,989 |
| 2007 | 4,821 | 4,491 | 5,022 | 4,742 | 5,029 | 4,863 | 4,984 | 4,747 | 4,911 | 5,125 | 5,005 | 5,277 |
| 2008 | 4,692 | 4,421 | 5,043 | 4,817 | 5,073 | 4,275 | 4,782 | 4,810 | 4,480 | 5,059 | 4,641 | 4,656 |
| 2009 | 4,638 | 4,471 | 5,000 | 4,750 | 5,024 | 4,919 | 4,807 | 4,923 | 4,692 | 5,113 | 4,913 | 4,647 |
| 2010 | 4,653 | 4,365 | 4,837 | 4,581 | 4,692 | 4,228 | 4,594 | 4,884 | 4,736 | 4,905 | 4,906 | 4,904 |
| 2011 | 4,458 | 3,569 | 4,953 | 4,780 | 4,869 | 4,579 | 4,850 | 4,802 | 4,610 | 4,720 | 4,499 | 4,782 |
| 2012 | 4,775 | 4,403 | 4,718 | 4,623 | 4,304 | 4,099 | 4,565 | 4,580 | 4,188 | 4,661 | 4,497 | 4,523 |
| 2013 | 3,970 | 4,020 | 4,319 | 4,253 | 4,251 | 4,348 | 4,554 | 4,677 | 4,393 | 4,552 | 4,067 | 4,154 |
| 2014 | 4,304 | 3,872 | 4,479 | 4,723 | 4,346 | 4,506 | 4,390 | 4,547 | 4,517 | 3,818 | 4,010 | 3,842 |
| 2015 | 4,078 | 3,967 | 4,333 | 4,384 | 4,338 | 4,562 | 4,641 | 5,117 | 4,756 | 4,639 | 4,610 | 4,142 |
| 2016 | 4,083 | 4,081 | 4,411 | 4,199 | 4,676 | 4,654 | 4,949 | 4,748 | 4,684 | 5,124 | 4,850 | 4,757 |
| 2017 | 4,583 | 4,552 | 5,135 | 5,176 | 5,112 | 4,960 | 5,199 | 4,919 | 4,800 | 5,712 | 4,559 | 4,850 |
| 2018 | 5,334 | 5,588 | 6,473 | 6,713 | 6,545 | 6,010 | 6,478 | 6,970 | 5,994 | 6,119 | 6,248 | 6,535 |
| 2019 | 6,717 | 6,363 | 7,100 | 6,572 | 6,770 | 6,531 | 6,640 | 6,219 | 5,862 | 6,405 | 6,333 | 6,332 |
| 2020 | 6,546 | 6,485 | 8,163 | 6,746 | 6,678 | 7,757 | 8,230 | 8,882 | 8,693 | 9,098 | 8,173 | 7,437 |
| 2021 | 7,641 | 5,918 | 7,506 | 8,501 | 7,930 | 7,841 | 8,374 | 8,763 | 8,647 | 9,088 | 9,664 | 8,868 |
| 2022 | -- | -- | -- | -- | -- | -- | -- | -- | -- | -- | -- | -- |
| 2023 | -- | -- | -- | -- | -- | -- | -- | -- | -- | -- | -- | -- |
| 2024 | -- | -- | ||||||||||
| - = No Data Reported; -- = Not Applicable; NA = Not Available; W = Withheld to avoid disclosure of individual company data. |
| Release Date: 4/30/2024 |
| Next Release Date: 5/31/2024 |