|
Download Data (XLS File) |
|
||||||||
|
||||||||
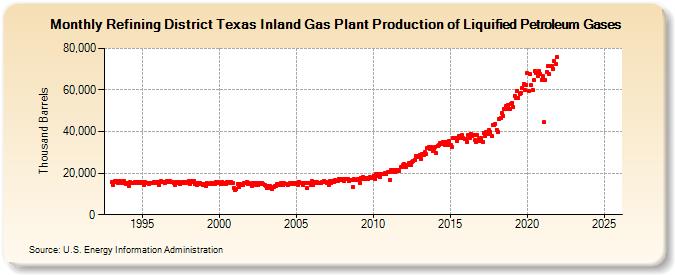
| Refining District Texas Inland Gas Plant Production of Liquified Petroleum Gases (Thousand Barrels) | ||||||||
| Year | Jan | Feb | Mar | Apr | May | Jun | Jul | Aug | Sep | Oct | Nov | Dec |
|---|---|---|---|---|---|---|---|---|---|---|---|---|
| 1993 | 15,503 | 14,510 | 16,017 | 15,719 | 16,085 | 15,320 | 15,976 | 15,708 | 15,404 | 16,328 | 15,216 | 14,827 |
| 1994 | 15,292 | 13,953 | 15,792 | 15,243 | 15,468 | 15,222 | 15,739 | 15,823 | 15,389 | 15,630 | 15,389 | 15,953 |
| 1995 | 15,568 | 14,303 | 15,653 | 15,251 | 15,265 | 14,716 | 15,395 | 15,476 | 15,338 | 15,936 | 15,690 | 15,377 |
| 1996 | 15,777 | 14,398 | 15,990 | 15,593 | 15,798 | 15,062 | 15,888 | 16,210 | 15,507 | 16,296 | 15,665 | 15,735 |
| 1997 | 15,154 | 14,450 | 15,834 | 15,186 | 15,498 | 14,550 | 15,486 | 15,759 | 15,262 | 15,807 | 15,416 | 15,889 |
| 1998 | 16,423 | 14,870 | 16,150 | 15,883 | 16,034 | 14,989 | 14,476 | 15,273 | 14,990 | 15,342 | 14,980 | 14,507 |
| 1999 | 14,935 | 13,987 | 15,372 | 14,928 | 14,982 | 15,120 | 15,437 | 14,863 | 14,960 | 15,638 | 15,159 | 15,605 |
| 2000 | 15,459 | 14,695 | 15,662 | 15,131 | 14,993 | 14,926 | 15,606 | 15,811 | 15,209 | 15,660 | 15,029 | 13,007 |
| 2001 | 11,847 | 12,571 | 14,907 | 13,545 | 14,984 | 14,419 | 14,482 | 15,156 | 15,077 | 15,808 | 14,986 | 15,217 |
| 2002 | 14,863 | 13,899 | 15,291 | 14,484 | 15,046 | 14,475 | 14,527 | 15,176 | 14,838 | 15,074 | 14,933 | 14,221 |
| 2003 | 13,886 | 13,078 | 13,878 | 13,847 | 12,653 | 12,453 | 13,323 | 13,906 | 13,876 | 14,653 | 14,587 | 14,341 |
| 2004 | 15,178 | 14,502 | 15,331 | 14,671 | 14,672 | 14,119 | 14,918 | 15,016 | 14,679 | 15,376 | 14,747 | 15,040 |
| 2005 | 15,336 | 14,458 | 15,928 | 15,454 | 15,443 | 14,506 | 15,396 | 15,060 | 12,828 | 15,284 | 15,117 | 14,351 |
| 2006 | 16,066 | 14,375 | 15,854 | 15,301 | 15,531 | 15,118 | 15,400 | 15,309 | 15,673 | 16,051 | 15,553 | 15,946 |
| 2007 | 15,288 | 14,328 | 16,077 | 15,382 | 16,335 | 15,810 | 16,541 | 16,287 | 16,349 | 17,342 | 16,789 | 17,165 |
| 2008 | 16,796 | 16,136 | 17,254 | 17,145 | 17,327 | 16,206 | 16,697 | 16,676 | 13,430 | 17,045 | 16,580 | 16,578 |
| 2009 | 17,359 | 15,465 | 17,675 | 17,233 | 18,130 | 17,225 | 17,421 | 17,513 | 17,278 | 18,113 | 17,848 | 17,792 |
| 2010 | 18,823 | 17,247 | 19,402 | 18,590 | 19,410 | 18,370 | 19,402 | 19,545 | 19,519 | 20,162 | 19,602 | 20,560 |
| 2011 | 20,654 | 16,934 | 21,326 | 20,323 | 21,629 | 20,534 | 21,713 | 21,388 | 21,196 | 22,924 | 22,958 | 23,743 |
| 2012 | 24,166 | 22,818 | 24,045 | 23,887 | 24,922 | 23,963 | 25,547 | 26,060 | 26,550 | 28,413 | 28,317 | 27,985 |
| 2013 | 28,497 | 27,011 | 29,336 | 28,928 | 29,938 | 29,025 | 31,885 | 32,404 | 31,848 | 32,785 | 30,558 | 31,627 |
| 2014 | 32,524 | 29,534 | 33,244 | 33,475 | 34,300 | 33,866 | 35,075 | 35,213 | 33,333 | 34,823 | 33,596 | 35,479 |
| 2015 | 33,672 | 32,389 | 36,949 | 36,898 | 36,911 | 35,592 | 36,890 | 37,667 | 36,864 | 38,220 | 36,829 | 36,639 |
| 2016 | 36,373 | 34,745 | 38,232 | 37,028 | 38,948 | 38,010 | 38,184 | 35,756 | 34,946 | 38,193 | 36,353 | 35,486 |
| 2017 | 36,712 | 34,944 | 39,386 | 37,813 | 39,799 | 38,915 | 40,789 | 39,798 | 37,851 | 43,378 | 43,152 | 43,768 |
| 2018 | 40,925 | 39,713 | 46,268 | 46,582 | 48,839 | 47,651 | 50,746 | 52,149 | 50,823 | 52,800 | 50,831 | 53,478 |
| 2019 | 53,970 | 51,743 | 57,314 | 56,255 | 59,641 | 56,314 | 57,845 | 58,586 | 61,076 | 62,782 | 60,186 | 62,575 |
| 2020 | 68,027 | 59,528 | 67,455 | 62,205 | 60,108 | 64,810 | 68,908 | 68,102 | 66,667 | 68,945 | 67,477 | 65,020 |
| 2021 | 66,578 | 44,445 | 64,775 | 68,566 | 71,372 | 67,544 | 71,360 | 71,409 | 70,269 | 73,927 | 72,399 | 75,832 |
| 2022 | -- | -- | -- | -- | -- | -- | -- | -- | -- | -- | -- | -- |
| 2023 | -- | -- | -- | -- | -- | -- | -- | -- | -- | -- | -- | -- |
| 2024 | -- | |||||||||||
| - = No Data Reported; -- = Not Applicable; NA = Not Available; W = Withheld to avoid disclosure of individual company data. |
| Release Date: 3/29/2024 |
| Next Release Date: 4/30/2024 |