|
Download Data (XLS File) |
|
||||||||
|
||||||||
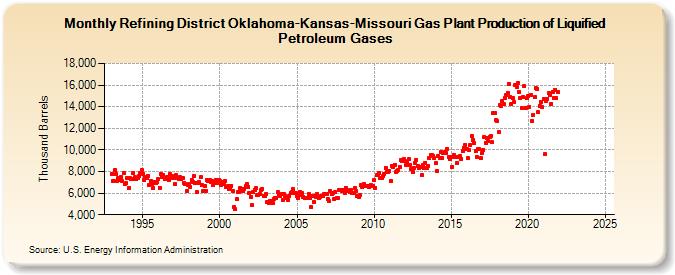
| Refining District Oklahoma-Kansas-Missouri Gas Plant Production of Liquified Petroleum Gases (Thousand Barrels) | ||||||||
| Year | Jan | Feb | Mar | Apr | May | Jun | Jul | Aug | Sep | Oct | Nov | Dec |
|---|---|---|---|---|---|---|---|---|---|---|---|---|
| 1993 | 7,783 | 7,161 | 8,129 | 7,766 | 7,158 | 7,359 | 7,215 | 7,478 | 7,088 | 7,825 | 6,819 | 6,903 |
| 1994 | 7,375 | 6,492 | 7,375 | 7,309 | 7,852 | 7,299 | 7,479 | 7,307 | 7,389 | 7,542 | 7,875 | 8,138 |
| 1995 | 7,810 | 7,251 | 7,452 | 7,360 | 7,627 | 6,776 | 7,095 | 6,814 | 6,513 | 7,018 | 6,906 | 7,053 |
| 1996 | 7,286 | 6,503 | 7,803 | 7,519 | 7,705 | 7,266 | 7,340 | 7,501 | 7,170 | 7,789 | 7,425 | 7,563 |
| 1997 | 7,367 | 6,853 | 7,648 | 7,380 | 7,336 | 7,465 | 7,268 | 7,372 | 6,966 | 6,880 | 6,166 | 6,714 |
| 1998 | 6,886 | 6,611 | 7,173 | 7,027 | 7,567 | 6,891 | 6,058 | 6,970 | 7,004 | 7,446 | 6,731 | 6,168 |
| 1999 | 6,643 | 6,231 | 7,195 | 7,106 | 7,198 | 7,036 | 7,093 | 6,782 | 6,980 | 7,223 | 6,943 | 7,237 |
| 2000 | 7,077 | 6,769 | 6,986 | 6,841 | 7,085 | 6,536 | 6,612 | 6,402 | 6,338 | 6,684 | 6,197 | 4,724 |
| 2001 | 4,498 | 5,427 | 6,120 | 6,124 | 6,454 | 6,401 | 6,237 | 6,398 | 6,640 | 6,842 | 6,589 | 6,014 |
| 2002 | 5,664 | 4,864 | 6,063 | 6,317 | 6,428 | 5,833 | 5,835 | 5,920 | 6,268 | 6,397 | 5,765 | 5,689 |
| 2003 | 5,923 | 5,194 | 5,127 | 5,294 | 5,281 | 5,091 | 5,461 | 5,581 | 5,508 | 6,066 | 5,865 | 5,711 |
| 2004 | 5,922 | 5,319 | 5,874 | 5,692 | 5,563 | 5,366 | 5,766 | 6,002 | 6,100 | 6,346 | 6,055 | 5,982 |
| 2005 | 5,765 | 5,559 | 6,146 | 5,837 | 5,981 | 5,685 | 5,523 | 5,519 | 5,518 | 5,914 | 5,535 | 4,728 |
| 2006 | 5,732 | 5,223 | 5,733 | 5,662 | 5,873 | 5,543 | 5,626 | 5,751 | 5,703 | 5,891 | 5,933 | 5,943 |
| 2007 | 5,466 | 5,230 | 6,184 | 5,937 | 6,043 | 5,488 | 6,100 | 5,562 | 5,554 | 6,275 | 6,254 | 6,231 |
| 2008 | 6,303 | 5,991 | 6,492 | 6,280 | 6,192 | 6,099 | 6,322 | 6,050 | 5,995 | 6,490 | 6,213 | 5,704 |
| 2009 | 5,684 | 5,842 | 6,740 | 6,542 | 6,837 | 6,635 | 6,644 | 6,692 | 6,521 | 6,664 | 6,768 | 6,661 |
| 2010 | 7,173 | 6,516 | 7,632 | 7,639 | 7,900 | 7,395 | 7,403 | 7,547 | 7,799 | 8,365 | 7,961 | 7,960 |
| 2011 | 8,028 | 7,112 | 8,533 | 8,428 | 8,630 | 7,940 | 8,037 | 8,181 | 8,412 | 9,087 | 8,977 | 9,117 |
| 2012 | 8,989 | 8,622 | 8,836 | 9,118 | 8,640 | 8,196 | 7,911 | 8,361 | 8,752 | 9,110 | 8,539 | 8,362 |
| 2013 | 8,425 | 7,697 | 8,569 | 8,281 | 8,830 | 8,298 | 8,514 | 9,219 | 9,524 | 9,561 | 9,481 | 9,205 |
| 2014 | 8,770 | 8,076 | 9,441 | 9,277 | 9,779 | 9,239 | 9,742 | 9,815 | 9,751 | 10,107 | 9,327 | 9,191 |
| 2015 | 9,307 | 8,445 | 9,514 | 9,381 | 9,376 | 8,827 | 9,300 | 9,450 | 9,190 | 9,881 | 10,204 | 10,431 |
| 2016 | 10,044 | 9,261 | 10,031 | 10,453 | 11,291 | 10,908 | 10,626 | 9,856 | 9,375 | 10,115 | 10,056 | 9,240 |
| 2017 | 9,702 | 10,027 | 11,189 | 10,667 | 11,092 | 10,805 | 11,225 | 11,312 | 10,707 | 13,409 | 13,407 | 12,751 |
| 2018 | 12,637 | 11,624 | 14,128 | 14,094 | 14,527 | 14,270 | 14,812 | 15,052 | 15,305 | 16,139 | 14,926 | 14,257 |
| 2019 | 14,790 | 14,417 | 16,014 | 15,844 | 16,189 | 15,382 | 14,762 | 13,861 | 14,899 | 15,888 | 13,900 | 14,832 |
| 2020 | 14,996 | 13,996 | 15,106 | 12,669 | 13,249 | 14,856 | 15,751 | 15,648 | 13,508 | 14,105 | 14,475 | 13,943 |
| 2021 | 14,720 | 9,580 | 14,548 | 14,745 | 15,243 | 15,048 | 14,289 | 15,382 | 14,849 | 15,579 | 14,795 | 15,363 |
| 2022 | -- | -- | -- | -- | -- | -- | -- | -- | -- | -- | -- | -- |
| 2023 | -- | -- | -- | -- | -- | -- | -- | -- | -- | -- | -- | -- |
| 2024 | -- | |||||||||||
| - = No Data Reported; -- = Not Applicable; NA = Not Available; W = Withheld to avoid disclosure of individual company data. |
| Release Date: 3/29/2024 |
| Next Release Date: 4/30/2024 |