|
Download Data (XLS File) |
|
||||||||
|
||||||||
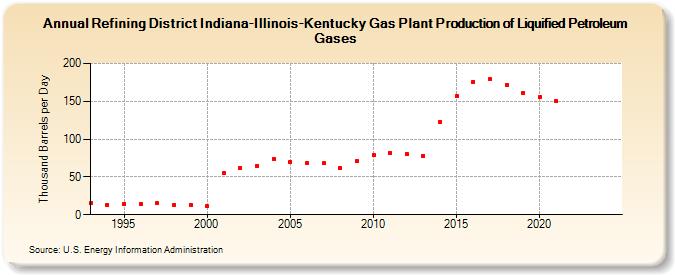
| Refining District Indiana-Illinois-Kentucky Gas Plant Production of Liquified Petroleum Gases (Thousand Barrels per Day) | ||||||||
| Decade | Year-0 | Year-1 | Year-2 | Year-3 | Year-4 | Year-5 | Year-6 | Year-7 | Year-8 | Year-9 |
|---|---|---|---|---|---|---|---|---|---|---|
| 1990's | 15 | 13 | 14 | 14 | 15 | 13 | 13 | |||
| 2000's | 11 | 55 | 62 | 65 | 74 | 70 | 69 | 68 | 62 | 71 |
| 2010's | 79 | 82 | 80 | 78 | 123 | 157 | 176 | 179 | 172 | 161 |
| 2020's | 156 | 150 | -- | -- |
| - = No Data Reported; -- = Not Applicable; NA = Not Available; W = Withheld to avoid disclosure of individual company data. |
| Release Date: 3/29/2024 |
| Next Release Date: 8/30/2024 |