|
Download Data (XLS File) |
|
||||||||
|
||||||||
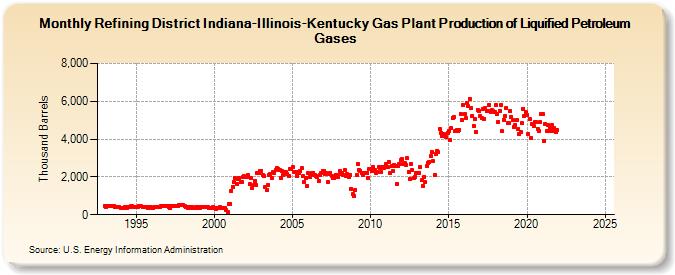
| Refining District Indiana-Illinois-Kentucky Gas Plant Production of Liquified Petroleum Gases (Thousand Barrels) | ||||||||
| Year | Jan | Feb | Mar | Apr | May | Jun | Jul | Aug | Sep | Oct | Nov | Dec |
|---|---|---|---|---|---|---|---|---|---|---|---|---|
| 1993 | 481 | 417 | 461 | 469 | 470 | 463 | 451 | 460 | 424 | 421 | 413 | 412 |
| 1994 | 367 | 332 | 372 | 421 | 406 | 377 | 425 | 418 | 435 | 448 | 429 | 417 |
| 1995 | 434 | 422 | 459 | 465 | 442 | 405 | 421 | 417 | 390 | 361 | 403 | 401 |
| 1996 | 365 | 340 | 408 | 422 | 414 | 402 | 431 | 446 | 442 | 478 | 465 | 480 |
| 1997 | 483 | 404 | 353 | 445 | 459 | 459 | 483 | 477 | 478 | 490 | 488 | 520 |
| 1998 | 490 | 449 | 426 | 389 | 363 | 406 | 360 | 396 | 360 | 370 | 394 | 418 |
| 1999 | 372 | 373 | 395 | 397 | 433 | 410 | 419 | 413 | 368 | 338 | 354 | 405 |
| 2000 | 331 | 311 | 340 | 357 | 384 | 357 | 355 | 377 | 349 | 235 | 143 | 554 |
| 2001 | 575 | 1,278 | 1,468 | 1,738 | 1,921 | 1,638 | 1,909 | 1,955 | 1,755 | 1,746 | 2,019 | 2,022 |
| 2002 | 1,998 | 1,994 | 2,075 | 1,618 | 1,958 | 1,421 | 1,556 | 1,797 | 1,557 | 2,207 | 2,206 | 2,297 |
| 2003 | 2,330 | 2,097 | 2,061 | 1,484 | 1,302 | 1,567 | 2,095 | 2,143 | 1,919 | 2,242 | 2,206 | 2,353 |
| 2004 | 2,463 | 2,434 | 2,357 | 1,952 | 2,299 | 2,113 | 2,254 | 2,243 | 2,155 | 2,033 | 2,433 | 2,411 |
| 2005 | 2,519 | 2,261 | 2,238 | 2,054 | 2,248 | 2,190 | 2,302 | 2,456 | 2,034 | 1,731 | 1,957 | 1,513 |
| 2006 | 2,196 | 2,004 | 2,075 | 2,218 | 2,229 | 2,079 | 2,067 | 1,969 | 1,790 | 2,113 | 2,212 | 2,303 |
| 2007 | 2,331 | 2,163 | 2,197 | 1,735 | 2,147 | 2,216 | 2,074 | 1,964 | 1,942 | 2,104 | 2,102 | 2,014 |
| 2008 | 2,312 | 2,132 | 2,206 | 2,104 | 2,349 | 2,062 | 2,161 | 2,001 | 2,096 | 1,381 | 1,079 | 966 |
| 2009 | 1,316 | 2,092 | 2,685 | 2,376 | 2,304 | 2,213 | 2,083 | 2,233 | 2,182 | 2,225 | 1,957 | 2,397 |
| 2010 | 2,435 | 2,337 | 2,525 | 2,364 | 2,220 | 2,260 | 2,522 | 2,484 | 2,277 | 2,499 | 2,491 | 2,536 |
| 2011 | 2,688 | 2,525 | 2,793 | 2,207 | 2,557 | 2,319 | 2,638 | 2,568 | 1,643 | 2,571 | 2,695 | 2,888 |
| 2012 | 2,944 | 2,672 | 2,741 | 2,640 | 2,980 | 2,258 | 1,895 | 2,675 | 2,358 | 1,946 | 2,009 | 2,228 |
| 2013 | 2,184 | 2,225 | 2,523 | 1,822 | 1,523 | 2,016 | 1,719 | 2,554 | 2,749 | 2,798 | 3,101 | 3,301 |
| 2014 | 2,823 | 2,120 | 3,231 | 3,382 | 3,316 | 4,536 | 4,349 | 4,148 | 4,286 | 4,234 | 4,098 | 4,336 |
| 2015 | 4,434 | 3,952 | 4,577 | 5,113 | 5,168 | 4,421 | 4,484 | 4,442 | 4,491 | 5,333 | 5,036 | 5,810 |
| 2016 | 5,332 | 5,119 | 5,919 | 5,735 | 6,143 | 5,667 | 5,216 | 4,713 | 5,060 | 4,400 | 5,558 | 5,474 |
| 2017 | 5,234 | 5,124 | 5,602 | 5,068 | 5,667 | 5,470 | 5,474 | 5,799 | 5,451 | 5,522 | 5,462 | 5,429 |
| 2018 | 5,800 | 5,329 | 4,924 | 5,475 | 5,818 | 4,410 | 5,019 | 5,200 | 5,620 | 4,846 | 4,844 | 5,463 |
| 2019 | 5,180 | 5,000 | 4,655 | 4,772 | 4,996 | 4,550 | 4,284 | 4,355 | 4,834 | 5,610 | 5,228 | 5,421 |
| 2020 | 5,288 | 4,277 | 5,042 | 4,073 | 4,825 | 4,687 | 4,891 | 4,885 | 4,560 | 4,414 | 4,889 | 5,349 |
| 2021 | 5,302 | 3,905 | 4,809 | 4,413 | 4,733 | 4,416 | 4,598 | 4,735 | 4,418 | 4,561 | 4,373 | 4,493 |
| 2022 | -- | -- | -- | -- | -- | -- | -- | -- | -- | -- | -- | -- |
| 2023 | -- | -- | -- | -- | -- | -- | -- | -- | -- | -- | -- | -- |
| 2024 | -- | |||||||||||
| - = No Data Reported; -- = Not Applicable; NA = Not Available; W = Withheld to avoid disclosure of individual company data. |
| Release Date: 3/29/2024 |
| Next Release Date: 4/30/2024 |