|
Download Data (XLS File) |
|
||||||||
|
||||||||
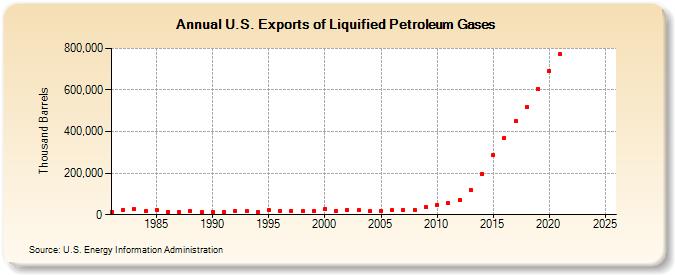
| U.S. Exports of Liquified Petroleum Gases (Thousand Barrels) | ||||||||
| Decade | Year-0 | Year-1 | Year-2 | Year-3 | Year-4 | Year-5 | Year-6 | Year-7 | Year-8 | Year-9 |
|---|---|---|---|---|---|---|---|---|---|---|
| 1980's | 15,365 | 23,596 | 26,786 | 17,537 | 22,773 | 15,397 | 13,904 | 17,847 | 12,633 | |
| 1990's | 14,437 | 15,120 | 17,883 | 15,660 | 13,991 | 21,024 | 18,576 | 18,229 | 15,488 | 18,147 |
| 2000's | 27,201 | 15,928 | 24,306 | 20,308 | 15,798 | 19,338 | 20,607 | 20,809 | 24,558 | 36,344 |
| 2010's | 48,050 | 54,131 | 71,918 | 121,058 | 196,054 | 285,976 | 369,604 | 449,255 | 517,909 | 605,476 |
| 2020's | 691,355 | 771,065 | -- | -- |
| - = No Data Reported; -- = Not Applicable; NA = Not Available; W = Withheld to avoid disclosure of individual company data. |
| Release Date: 8/30/2024 |
| Next Release Date: 8/29/2025 |