|
Download Data (XLS File) |
|
||||||||
|
||||||||
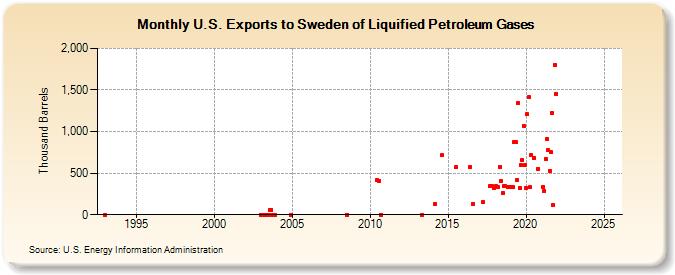
| U.S. Exports to Sweden of Liquified Petroleum Gases (Thousand Barrels) | ||||||||
| Year | Jan | Feb | Mar | Apr | May | Jun | Jul | Aug | Sep | Oct | Nov | Dec |
|---|---|---|---|---|---|---|---|---|---|---|---|---|
| 1993 | 0 | |||||||||||
| 2003 | 0 | 0 | 0 | 0 | 0 | 0 | 0 | 60 | 60 | 0 | 0 | 0 |
| 2004 | 0 | |||||||||||
| 2008 | 0 | |||||||||||
| 2010 | 412 | 410 | 0 | |||||||||
| 2013 | 0 | |||||||||||
| 2014 | 130 | 713 | ||||||||||
| 2015 | 573 | |||||||||||
| 2016 | 572 | 131 | ||||||||||
| 2017 | 148 | 340 | 340 | 320 | ||||||||
| 2018 | 340 | 338 | 578 | 400 | 264 | 340 | 340 | 328 | ||||
| 2019 | 336 | 333 | 871 | 877 | 416 | 1,341 | 327 | 594 | 654 | 1,065 | 593 | |
| 2020 | 327 | 1,208 | 1,412 | 329 | 721 | 683 | 553 | |||||
| 2021 | 339 | 283 | 674 | 911 | 778 | 527 | 749 | 1,222 | 112 | 1,805 | 1,456 | |
| 2022 | -- | -- | -- | -- | -- | -- | -- | -- | -- | -- | -- | -- |
| 2023 | -- | -- | -- | -- | -- | -- | -- | -- | -- | -- | -- | -- |
| 2024 | -- | |||||||||||
| - = No Data Reported; -- = Not Applicable; NA = Not Available; W = Withheld to avoid disclosure of individual company data. |
| Release Date: 3/29/2024 |
| Next Release Date: 4/30/2024 |