|
Download Data (XLS File) |
|
||||||||
|
||||||||
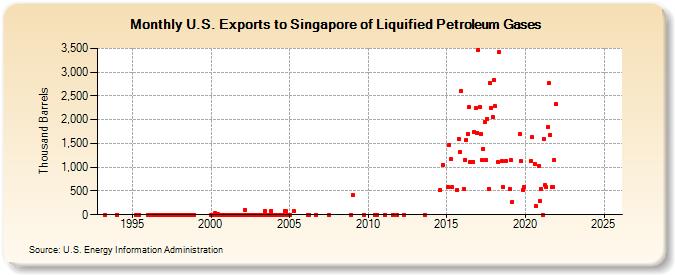
| U.S. Exports to Singapore of Liquified Petroleum Gases (Thousand Barrels) | ||||||||
| Year | Jan | Feb | Mar | Apr | May | Jun | Jul | Aug | Sep | Oct | Nov | Dec |
|---|---|---|---|---|---|---|---|---|---|---|---|---|
| 1993 | 0 | |||||||||||
| 1994 | 1 | |||||||||||
| 1995 | 0 | 0 | ||||||||||
| 1996 | 0 | 0 | 0 | 0 | 0 | 0 | 0 | 0 | 0 | 0 | 0 | 0 |
| 1997 | 0 | 0 | 0 | 0 | 0 | 0 | 0 | 0 | 0 | 0 | 0 | 0 |
| 1998 | 3 | 0 | 0 | 0 | 0 | 0 | 0 | 2 | 0 | 0 | 0 | 0 |
| 2000 | 0 | 0 | 0 | 32 | 0 | 6 | 0 | 0 | 0 | 0 | 0 | 0 |
| 2001 | 0 | 0 | 0 | 0 | 0 | 0 | 0 | 0 | 0 | 1 | 1 | 0 |
| 2002 | 0 | 0 | 106 | 0 | 0 | 0 | 0 | 0 | 0 | 0 | 0 | 0 |
| 2003 | 0 | 0 | 0 | 0 | 0 | 82 | 0 | 0 | 0 | 0 | 82 | 0 |
| 2004 | 0 | 0 | 0 | 0 | 0 | 0 | 0 | 0 | 82 | 82 | 0 | 0 |
| 2005 | 0 | 82 | ||||||||||
| 2006 | 0 | 1 | 0 | |||||||||
| 2007 | 0 | |||||||||||
| 2008 | 0 | |||||||||||
| 2009 | 413 | 0 | ||||||||||
| 2010 | 0 | 0 | ||||||||||
| 2011 | 0 | 0 | 0 | |||||||||
| 2012 | 0 | |||||||||||
| 2013 | 1 | |||||||||||
| 2014 | 522 | 1,052 | ||||||||||
| 2015 | 574 | 1,471 | 1,164 | 575 | 525 | 1,598 | 1,319 | 2,606 | ||||
| 2016 | 550 | 1,161 | 1,567 | 1,704 | 2,263 | 1,108 | 1,116 | 1,741 | 2,250 | 1,730 | ||
| 2017 | 3,470 | 2,266 | 1,703 | 1,157 | 1,389 | 1,951 | 1,154 | 2,023 | 550 | 2,767 | 2,252 | 2,056 |
| 2018 | 2,832 | 2,282 | 1,105 | 3,420 | 1,124 | 578 | 1,132 | |||||
| 2019 | 551 | 1,141 | 271 | 1,699 | 1,125 | 510 | 583 | |||||
| 2020 | 1,122 | 1,630 | 1,077 | 181 | 1,030 | 291 | ||||||
| 2021 | 549 | 0 | 1,596 | 622 | 585 | 1,851 | 2,771 | 1,681 | 578 | 574 | 1,152 | 2,321 |
| 2022 | -- | -- | -- | -- | -- | -- | -- | -- | -- | -- | -- | -- |
| 2023 | -- | -- | -- | -- | -- | -- | -- | -- | -- | -- | -- | -- |
| 2024 | -- | |||||||||||
| - = No Data Reported; -- = Not Applicable; NA = Not Available; W = Withheld to avoid disclosure of individual company data. |
| Release Date: 3/29/2024 |
| Next Release Date: 4/30/2024 |