|
Download Data (XLS File) |
|
||||||||
|
||||||||
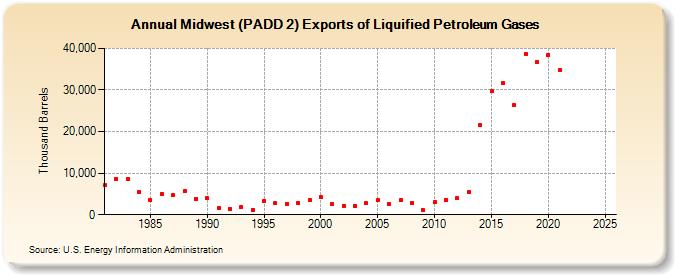
| Midwest (PADD 2) Exports of Liquified Petroleum Gases (Thousand Barrels) | ||||||||
| Decade | Year-0 | Year-1 | Year-2 | Year-3 | Year-4 | Year-5 | Year-6 | Year-7 | Year-8 | Year-9 |
|---|---|---|---|---|---|---|---|---|---|---|
| 1980's | 7,041 | 8,677 | 8,570 | 5,569 | 3,541 | 5,073 | 4,790 | 5,661 | 3,844 | |
| 1990's | 3,933 | 1,717 | 1,483 | 1,853 | 1,196 | 3,301 | 2,707 | 2,631 | 2,841 | 3,510 |
| 2000's | 4,155 | 2,507 | 2,184 | 2,161 | 2,715 | 3,426 | 2,670 | 3,445 | 2,895 | 1,044 |
| 2010's | 3,055 | 3,628 | 3,902 | 5,399 | 21,676 | 29,668 | 31,659 | 26,292 | 38,712 | 36,782 |
| 2020's | 38,503 | 34,709 | -- | -- |
| - = No Data Reported; -- = Not Applicable; NA = Not Available; W = Withheld to avoid disclosure of individual company data. |
| Release Date: 8/30/2024 |
| Next Release Date: 8/29/2025 |