|
Download Data (XLS File) |
|
||||||||
|
||||||||
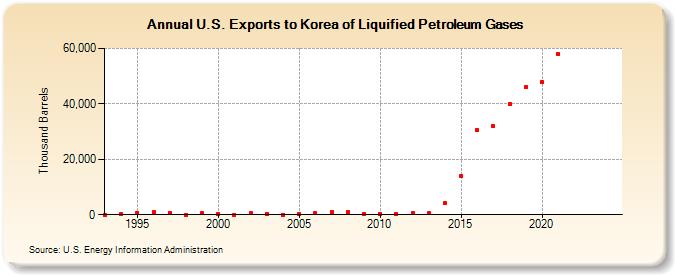
| U.S. Exports to Korea of Liquified Petroleum Gases (Thousand Barrels) | ||||||||
| Decade | Year-0 | Year-1 | Year-2 | Year-3 | Year-4 | Year-5 | Year-6 | Year-7 | Year-8 | Year-9 |
|---|---|---|---|---|---|---|---|---|---|---|
| 1990's | 39 | 238 | 706 | 910 | 783 | 7 | 447 | |||
| 2000's | 289 | 0 | 604 | 250 | 31 | 126 | 513 | 931 | 848 | 378 |
| 2010's | 436 | 138 | 661 | 525 | 4,191 | 13,999 | 30,421 | 31,823 | 39,908 | 46,002 |
| 2020's | 47,958 | 58,152 | -- | -- |
| - = No Data Reported; -- = Not Applicable; NA = Not Available; W = Withheld to avoid disclosure of individual company data. |
| Release Date: 3/29/2024 |
| Next Release Date: 8/30/2024 |