|
Download Data (XLS File) |
|
||||||||
|
||||||||
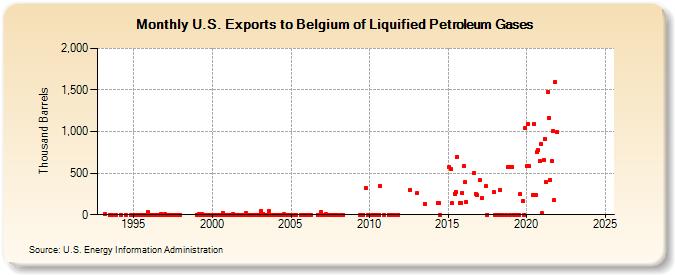
| U.S. Exports to Belgium of Liquified Petroleum Gases (Thousand Barrels) | ||||||||
| Year | Jan | Feb | Mar | Apr | May | Jun | Jul | Aug | Sep | Oct | Nov | Dec |
|---|---|---|---|---|---|---|---|---|---|---|---|---|
| 1993 | 9 | 0 | 1 | 0 | ||||||||
| 1994 | 1 | 1 | 0 | 0 | ||||||||
| 1995 | 0 | 1 | 0 | 0 | 0 | 0 | 0 | 0 | 0 | 0 | 0 | 29 |
| 1996 | 0 | 0 | 0 | 0 | 0 | 0 | 0 | 0 | 0 | 7 | 0 | 0 |
| 1997 | 3 | 0 | 0 | 0 | 0 | 0 | 0 | 0 | 0 | 0 | 0 | 0 |
| 1999 | 0 | 0 | 3 | 0 | 3 | 0 | 2 | 0 | 0 | 0 | 0 | 0 |
| 2000 | 0 | 0 | 0 | 0 | 0 | 0 | 0 | 0 | 26 | 0 | 0 | 0 |
| 2001 | 0 | 0 | 0 | 0 | 6 | 0 | 0 | 0 | 0 | 0 | 0 | 0 |
| 2002 | 0 | 2 | 17 | 0 | 0 | 0 | 2 | 0 | 0 | 2 | 2 | 0 |
| 2003 | 0 | 45 | 0 | 12 | 0 | 0 | 0 | 39 | 0 | 0 | 0 | 0 |
| 2004 | 0 | 0 | 0 | 1 | 0 | 0 | 1 | 3 | 0 | 0 | 0 | 0 |
| 2005 | 0 | 0 | 1 | 0 | 1 | 0 | ||||||
| 2006 | 0 | 0 | 0 | 27 | ||||||||
| 2007 | 0 | 0 | 5 | 0 | 0 | 1 | 0 | 0 | 0 | 0 | ||
| 2008 | 2 | 1 | 2 | |||||||||
| 2009 | 0 | 0 | 0 | 324 | 0 | |||||||
| 2010 | 1 | 0 | 0 | 1 | 350 | 0 | ||||||
| 2011 | 0 | 1 | 0 | 1 | 0 | |||||||
| 2012 | 303 | |||||||||||
| 2013 | 256 | 133 | ||||||||||
| 2014 | 135 | 135 | 0 | |||||||||
| 2015 | 573 | 553 | 136 | 251 | 276 | 696 | 146 | 146 | 259 | |||
| 2016 | 580 | 392 | 154 | 500 | 252 | 242 | ||||||
| 2017 | 413 | 201 | 340 | 0 | 271 | |||||||
| 2018 | 0 | 0 | 0 | 301 | 0 | 0 | 577 | 0 | ||||
| 2019 | 575 | 569 | 0 | 0 | 0 | 0 | 0 | 249 | 161 | 0 | 1,042 | |
| 2020 | 588 | 1,087 | 582 | 242 | 1,087 | 240 | 750 | 777 | 645 | 849 | ||
| 2021 | 15 | 658 | 914 | 395 | 1,473 | 1,164 | 422 | 644 | 1,002 | 172 | 1,601 | 992 |
| 2022 | -- | -- | -- | -- | -- | -- | -- | -- | -- | -- | -- | -- |
| 2023 | -- | -- | -- | -- | -- | -- | -- | -- | -- | -- | -- | -- |
| 2024 | -- | -- | -- | -- | ||||||||
| - = No Data Reported; -- = Not Applicable; NA = Not Available; W = Withheld to avoid disclosure of individual company data. |
| Release Date: 6/28/2024 |
| Next Release Date: 7/31/2024 |