|
Download Data (XLS File) |
|
||||||||
|
||||||||
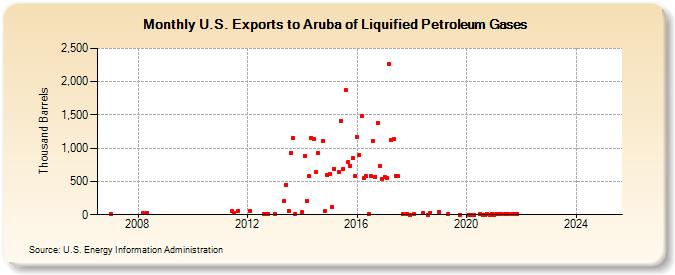
| U.S. Exports to Aruba of Liquified Petroleum Gases (Thousand Barrels) | ||||||||
| Year | Jan | Feb | Mar | Apr | May | Jun | Jul | Aug | Sep | Oct | Nov | Dec |
|---|---|---|---|---|---|---|---|---|---|---|---|---|
| 2007 | 10 | |||||||||||
| 2008 | 21 | 29 | ||||||||||
| 2011 | 53 | 30 | 60 | |||||||||
| 2012 | 55 | 6 | 16 | 13 | ||||||||
| 2013 | 10 | 200 | 453 | 54 | 928 | 1,160 | 16 | |||||
| 2014 | 40 | 887 | 209 | 577 | 1,149 | 1,145 | 635 | 929 | 1,115 | 53 | 591 | |
| 2015 | 606 | 116 | 691 | 640 | 1,403 | 689 | 1,878 | 790 | 735 | 850 | 578 | |
| 2016 | 1,171 | 904 | 1,490 | 550 | 578 | 10 | 578 | 1,112 | 568 | 1,385 | 731 | 534 |
| 2017 | 574 | 557 | 2,272 | 1,125 | 1,143 | 583 | 578 | 14 | 13 | 0 | ||
| 2018 | 14 | 31 | 0 | 31 | ||||||||
| 2019 | 48 | 14 | 0 | |||||||||
| 2020 | 2 | 1 | 2 | 12 | 1 | 0 | 15 | 0 | 14 | |||
| 2021 | 1 | 14 | 12 | 15 | 14 | 11 | 11 | 11 | 12 | |||
| 2022 | -- | -- | -- | -- | ||||||||
| 2023 | -- | -- | -- | -- | -- | -- | ||||||
| 2024 | -- | -- | -- | -- | -- | -- | ||||||
| 2025 | -- | -- | ||||||||||
| - = No Data Reported; -- = Not Applicable; NA = Not Available; W = Withheld to avoid disclosure of individual company data. |
| Release Date: 6/30/2025 |
| Next Release Date: 7/31/2025 |