|
Download Data (XLS File) |
|
||||||||
|
||||||||
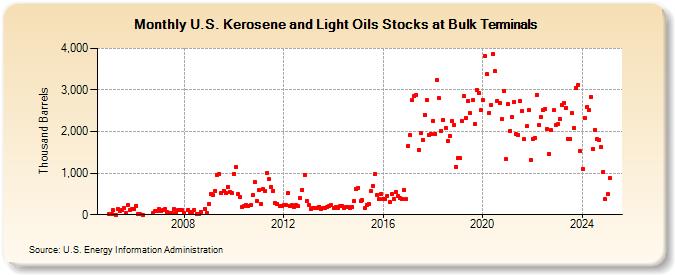
| U.S. Kerosene and Light Oils Stocks at Bulk Terminals (Thousand Barrels) | ||||||||
| Year | Jan | Feb | Mar | Apr | May | Jun | Jul | Aug | Sep | Oct | Nov | Dec |
|---|---|---|---|---|---|---|---|---|---|---|---|---|
| 2005 | 17 | 10 | 105 | 5 | 142 | 93 | 123 | 162 | 32 | 225 | 119 | 142 |
| 2006 | 131 | 218 | 6 | 6 | 1 | 33 | 83 | 83 | ||||
| 2007 | 128 | 84 | 121 | 137 | 74 | 32 | 51 | 138 | 43 | 111 | 111 | 106 |
| 2008 | 39 | 115 | 70 | 70 | 118 | 29 | 26 | 76 | 138 | 31 | ||
| 2009 | 265 | 509 | 468 | 575 | 948 | 984 | 520 | 580 | 522 | 677 | 555 | 519 |
| 2010 | 990 | 1,136 | 493 | 438 | 197 | 212 | 236 | 200 | 227 | 479 | 791 | 331 |
| 2011 | 594 | 259 | 614 | 561 | 1,008 | 851 | 667 | 578 | 271 | 265 | 207 | 218 |
| 2012 | 234 | 223 | 511 | 216 | 225 | 191 | 228 | 198 | 402 | 601 | 966 | 328 |
| 2013 | 226 | 146 | 156 | 159 | 163 | 191 | 144 | 162 | 170 | 181 | 214 | 227 |
| 2014 | 161 | 174 | 169 | 199 | 208 | 168 | 181 | 182 | 170 | 181 | 321 | 611 |
| 2015 | 653 | 323 | 347 | 150 | 223 | 255 | 565 | 697 | 980 | 478 | 366 | 504 |
| 2016 | 380 | 368 | 461 | 302 | 493 | 381 | 547 | 450 | 401 | 386 | 591 | 367 |
| 2017 | 1,662 | 1,909 | 2,750 | 2,846 | 2,887 | 1,554 | 1,968 | 1,808 | 2,405 | 2,766 | 1,927 | 1,939 |
| 2018 | 2,264 | 1,937 | 3,239 | 2,799 | 2,022 | 2,280 | 2,082 | 1,770 | 1,897 | 2,248 | 2,158 | 1,152 |
| 2019 | 1,368 | 1,363 | 2,256 | 2,844 | 2,321 | 2,745 | 2,446 | 2,750 | 2,179 | 3,002 | 2,931 | 2,507 |
| 2020 | 2,760 | 3,816 | 3,375 | 2,458 | 2,649 | 3,864 | 3,449 | 2,739 | 2,678 | 2,305 | 2,972 | 1,328 |
| 2021 | 2,652 | 2,013 | 2,362 | 2,722 | 1,940 | 1,923 | 2,731 | 2,497 | 1,809 | 2,126 | 2,507 | 1,325 |
| 2022 | 1,822 | 1,850 | 2,889 | 2,155 | 2,340 | 2,510 | 2,543 | 2,055 | 1,472 | 2,027 | 2,509 | 2,147 |
| 2023 | 2,174 | 2,297 | 2,647 | 2,682 | 2,577 | 1,829 | 1,831 | 2,475 | 2,124 | 3,055 | 3,121 | 1,524 |
| 2024 | 1,101 | |||||||||||
| - = No Data Reported; -- = Not Applicable; NA = Not Available; W = Withheld to avoid disclosure of individual company data. |
| Release Date: 3/29/2024 |
| Next Release Date: 4/30/2024 |