|
Download Data (XLS File) |
|
||||||||
|
||||||||
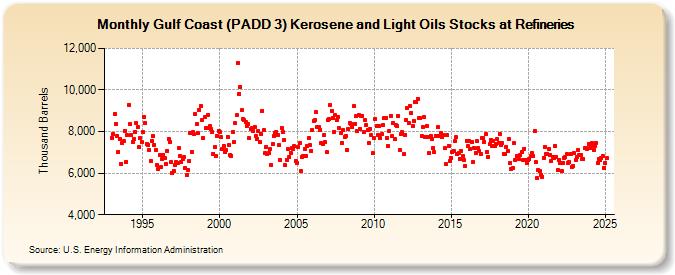
| Gulf Coast (PADD 3) Kerosene and Light Oils Stocks at Refineries (Thousand Barrels) | ||||||||
| Year | Jan | Feb | Mar | Apr | May | Jun | Jul | Aug | Sep | Oct | Nov | Dec |
|---|---|---|---|---|---|---|---|---|---|---|---|---|
| 1993 | 7,706 | 7,861 | 8,853 | 8,351 | 7,774 | 7,040 | 7,619 | 6,460 | 7,437 | 7,527 | 8,039 | 6,551 |
| 1994 | 7,820 | 9,293 | 8,362 | 7,813 | 7,504 | 7,644 | 7,980 | 8,408 | 8,210 | 7,250 | 7,697 | 7,507 |
| 1995 | 7,956 | 8,720 | 8,397 | 7,404 | 7,359 | 7,103 | 6,605 | 7,556 | 7,774 | 7,364 | 7,129 | 6,385 |
| 1996 | 6,188 | 6,887 | 6,302 | 6,672 | 6,889 | 6,705 | 6,454 | 7,083 | 7,641 | 7,497 | 6,527 | 6,008 |
| 1997 | 6,121 | 6,387 | 6,539 | 6,499 | 7,195 | 6,828 | 6,542 | 6,682 | 6,757 | 6,241 | 5,889 | 6,158 |
| 1998 | 6,596 | 7,913 | 7,033 | 7,957 | 7,870 | 8,849 | 8,343 | 7,909 | 9,058 | 9,225 | 8,558 | 7,710 |
| 1999 | 8,696 | 8,164 | 8,148 | 8,797 | 8,246 | 8,109 | 7,985 | 6,941 | 7,241 | 6,843 | 7,784 | 8,045 |
| 2000 | 7,965 | 7,730 | 7,147 | 7,324 | 7,001 | 7,104 | 7,750 | 7,347 | 6,892 | 6,841 | 7,979 | 7,500 |
| 2001 | 8,391 | 8,779 | 11,320 | 9,830 | 10,161 | 9,019 | 8,597 | 8,535 | 8,466 | 8,282 | 8,385 | 7,669 |
| 2002 | 8,104 | 8,166 | 8,032 | 8,214 | 7,787 | 7,655 | 8,026 | 7,515 | 7,900 | 9,010 | 8,063 | 6,950 |
| 2003 | 7,257 | 6,925 | 6,986 | 7,138 | 6,386 | 7,409 | 7,796 | 7,947 | 7,995 | 7,839 | 7,343 | 6,655 |
| 2004 | 8,189 | 7,960 | 7,598 | 6,375 | 6,654 | 7,144 | 6,788 | 6,969 | 7,208 | 7,150 | 7,296 | 6,581 |
| 2005 | 6,466 | 7,258 | 7,433 | 6,091 | 6,758 | 6,825 | 7,173 | 6,805 | 7,321 | 7,673 | 7,350 | 7,088 |
| 2006 | 8,072 | 8,514 | 8,541 | 8,918 | 8,210 | 8,200 | 8,088 | 7,461 | 7,423 | 7,828 | 7,478 | 6,995 |
| 2007 | 8,551 | 8,590 | 9,289 | 9,005 | 8,667 | 8,002 | 8,782 | 8,540 | 8,693 | 8,161 | 7,927 | 7,470 |
| 2008 | 8,069 | 7,748 | 7,796 | 7,113 | 8,099 | 8,433 | 8,380 | 8,238 | 9,210 | 8,378 | 8,726 | 8,015 |
| 2009 | 8,788 | 8,144 | 8,756 | 8,760 | 7,970 | 8,548 | 8,303 | 8,063 | 7,464 | 8,138 | 7,815 | 6,951 |
| 2010 | 7,688 | 8,612 | 8,259 | 7,846 | 8,265 | 7,688 | 7,863 | 8,327 | 8,635 | 8,668 | 7,705 | 7,312 |
| 2011 | 8,017 | 8,760 | 7,763 | 8,406 | 7,658 | 8,310 | 8,257 | 8,762 | 7,136 | 7,898 | 7,960 | 6,901 |
| 2012 | 7,850 | 8,561 | 9,153 | 8,416 | 9,232 | 8,915 | 8,248 | 8,499 | 9,429 | 9,411 | 9,574 | 8,630 |
| 2013 | 8,650 | 7,788 | 8,208 | 8,716 | 7,757 | 8,284 | 7,715 | 6,978 | 7,803 | 7,658 | 7,220 | 7,013 |
| 2014 | 7,781 | 7,807 | 8,200 | 7,798 | 7,926 | 7,757 | 7,826 | 7,192 | 6,417 | 7,814 | 7,314 | 6,584 |
| 2015 | 6,742 | 6,995 | 7,068 | 7,539 | 7,724 | 6,906 | 6,967 | 6,686 | 7,073 | 6,808 | 6,624 | 6,358 |
| 2016 | 7,559 | 7,282 | 7,531 | 7,170 | 7,509 | 6,531 | 7,204 | 6,964 | 7,526 | 7,197 | 7,059 | 6,929 |
| 2017 | 7,687 | 7,681 | 7,513 | 7,864 | 7,017 | 6,772 | 7,386 | 7,596 | 7,307 | 7,568 | 7,290 | 7,394 |
| 2018 | 7,629 | 7,450 | 7,886 | 7,337 | 7,435 | 6,938 | 6,928 | 7,272 | 7,069 | 7,644 | 6,500 | 6,210 |
| 2019 | 6,258 | 7,431 | 6,613 | 6,813 | 6,847 | 6,656 | 6,860 | 7,018 | 6,608 | 7,181 | 6,648 | 6,464 |
| 2020 | 6,633 | 6,703 | 6,804 | 6,967 | 6,815 | 8,033 | 6,528 | 5,760 | 6,149 | 6,086 | 5,911 | 5,832 |
| 2021 | 6,748 | 7,263 | 6,922 | 6,939 | 7,140 | 6,895 | 6,602 | 6,779 | 6,748 | 7,302 | 6,773 | 6,140 |
| 2022 | 6,643 | 6,502 | 6,080 | 6,507 | 6,746 | 6,752 | 6,905 | 6,500 | 6,531 | 6,937 | 6,288 | 6,355 |
| 2023 | 6,781 | 6,473 | 6,613 | 6,934 | 6,718 | 6,701 | 6,497 | 6,516 | 7,027 | 6,979 | 6,907 | 7,402 |
| 2024 | 7,214 | |||||||||||
| - = No Data Reported; -- = Not Applicable; NA = Not Available; W = Withheld to avoid disclosure of individual company data. |
| Release Date: 3/29/2024 |
| Next Release Date: 4/30/2024 |