|
Download Data (XLS File) |
|
||||||||
|
||||||||
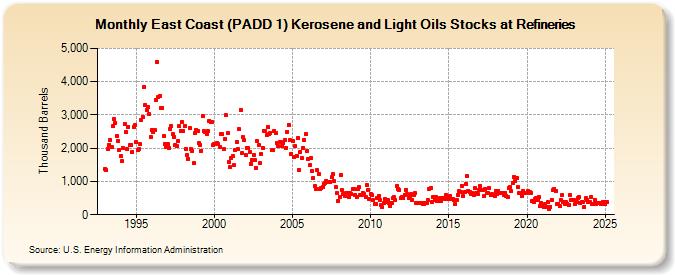
| East Coast (PADD 1) Kerosene and Light Oils Stocks at Refineries (Thousand Barrels) | ||||||||
| Year | Jan | Feb | Mar | Apr | May | Jun | Jul | Aug | Sep | Oct | Nov | Dec |
|---|---|---|---|---|---|---|---|---|---|---|---|---|
| 1993 | 1,388 | 1,342 | 1,990 | 2,107 | 2,243 | 2,042 | 2,655 | 2,875 | 2,746 | 2,379 | 2,222 | 1,949 |
| 1994 | 1,758 | 1,614 | 1,999 | 2,727 | 2,501 | 1,974 | 2,647 | 2,084 | 2,094 | 1,891 | 2,643 | 2,697 |
| 1995 | 2,179 | 1,940 | 1,971 | 2,113 | 2,851 | 2,951 | 3,837 | 3,312 | 3,139 | 3,233 | 3,026 | 2,350 |
| 1996 | 2,557 | 2,475 | 2,547 | 3,450 | 4,585 | 3,552 | 3,581 | 3,206 | 3,202 | 2,363 | 2,114 | 2,044 |
| 1997 | 2,133 | 2,008 | 2,588 | 2,658 | 2,422 | 2,347 | 2,096 | 2,059 | 2,212 | 2,654 | 2,531 | 2,788 |
| 1998 | 2,517 | 2,661 | 1,980 | 1,796 | 1,667 | 2,604 | 1,963 | 1,920 | 1,552 | 2,447 | 2,553 | 2,521 |
| 1999 | 2,142 | 2,100 | 1,922 | 2,971 | 2,521 | 2,488 | 2,431 | 2,520 | 2,828 | 2,799 | 2,788 | 2,093 |
| 2000 | 2,117 | 2,130 | 2,153 | 2,125 | 2,044 | 2,426 | 2,417 | 1,962 | 2,290 | 2,986 | 2,442 | 1,574 |
| 2001 | 1,421 | 1,718 | 1,765 | 1,484 | 1,937 | 2,190 | 1,967 | 2,576 | 3,152 | 1,846 | 2,324 | 2,233 |
| 2002 | 1,785 | 2,016 | 1,992 | 1,899 | 1,537 | 1,654 | 1,783 | 1,640 | 1,410 | 2,207 | 2,091 | 1,544 |
| 2003 | 1,826 | 2,006 | 2,531 | 2,506 | 2,394 | 2,642 | 2,415 | 2,458 | 1,947 | 1,950 | 2,530 | 2,467 |
| 2004 | 2,165 | 2,052 | 2,183 | 2,175 | 2,063 | 2,145 | 2,257 | 2,010 | 2,498 | 2,708 | 2,235 | 1,832 |
| 2005 | 2,217 | 1,727 | 2,055 | 1,775 | 2,309 | 1,340 | 1,896 | 1,701 | 2,010 | 2,247 | 2,419 | 1,919 |
| 2006 | 1,676 | 1,483 | 1,711 | 1,304 | 1,106 | 858 | 784 | 1,336 | 1,236 | 786 | 812 | 846 |
| 2007 | 936 | 961 | 1,023 | 998 | 981 | 979 | 1,121 | 1,226 | 1,003 | 834 | 646 | 425 |
| 2008 | 530 | 1,189 | 750 | 613 | 575 | 641 | 647 | 519 | 658 | 631 | 780 | 779 |
| 2009 | 585 | 543 | 763 | 822 | 594 | 601 | 664 | 617 | 527 | 882 | 755 | 480 |
| 2010 | 628 | 579 | 433 | 311 | 336 | 503 | 566 | 457 | 290 | 223 | 361 | 478 |
| 2011 | 394 | 441 | 363 | 253 | 354 | 496 | 522 | 445 | 860 | 786 | 746 | 491 |
| 2012 | 544 | 507 | 603 | 746 | 612 | 506 | 547 | 629 | 457 | 604 | 648 | 361 |
| 2013 | 367 | 360 | 345 | 340 | 308 | 329 | 353 | 354 | 441 | 788 | 804 | 371 |
| 2014 | 527 | 431 | 529 | 415 | 409 | 492 | 426 | 492 | 494 | 476 | 584 | 464 |
| 2015 | 480 | 560 | 468 | 466 | 452 | 318 | 430 | 607 | 714 | 684 | 874 | 552 |
| 2016 | 675 | 920 | 1,156 | 714 | 680 | 633 | 652 | 597 | 795 | 640 | 617 | 754 |
| 2017 | 867 | 755 | 737 | 567 | 770 | 659 | 645 | 795 | 587 | 620 | 602 | 571 |
| 2018 | 724 | 635 | 703 | 651 | 663 | 650 | 606 | 664 | 573 | 519 | 801 | 823 |
| 2019 | 707 | 959 | 1,145 | 1,010 | 1,114 | 828 | 663 | 645 | 552 | 698 | 652 | 640 |
| 2020 | 665 | 702 | 679 | 656 | 422 | 397 | 477 | 495 | 456 | 526 | 257 | 347 |
| 2021 | 296 | 239 | 311 | 238 | 375 | 186 | 244 | 450 | 729 | 772 | 723 | 337 |
| 2022 | 334 | 258 | 440 | 586 | 389 | 332 | 376 | 335 | 285 | 587 | 444 | 431 |
| 2023 | 447 | 312 | 372 | 508 | 527 | 353 | 379 | 371 | 245 | 494 | 429 | 396 |
| 2024 | 381 | 528 | 318 | 333 | ||||||||
| - = No Data Reported; -- = Not Applicable; NA = Not Available; W = Withheld to avoid disclosure of individual company data. |
| Release Date: 6/28/2024 |
| Next Release Date: 7/31/2024 |