|
Download Data (XLS File) |
|
||||||||
|
||||||||
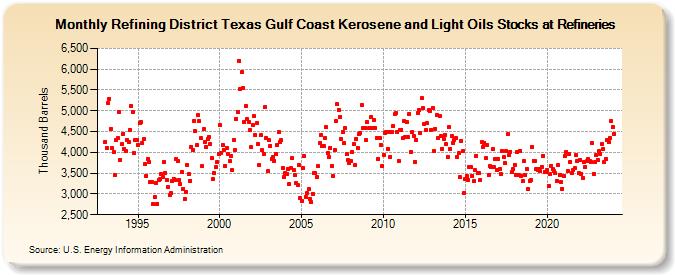
| Refining District Texas Gulf Coast Kerosene and Light Oils Stocks at Refineries (Thousand Barrels) | ||||||||
| Year | Jan | Feb | Mar | Apr | May | Jun | Jul | Aug | Sep | Oct | Nov | Dec |
|---|---|---|---|---|---|---|---|---|---|---|---|---|
| 1993 | 4,254 | 4,115 | 5,177 | 5,294 | 4,570 | 4,108 | 4,014 | 3,464 | 4,303 | 4,334 | 4,971 | 3,824 |
| 1994 | 4,199 | 4,442 | 4,085 | 4,040 | 4,302 | 4,257 | 4,547 | 5,117 | 4,964 | 3,984 | 4,288 | 4,303 |
| 1995 | 4,179 | 4,696 | 4,727 | 4,227 | 4,316 | 3,708 | 3,435 | 3,839 | 3,777 | 3,297 | 3,276 | 2,750 |
| 1996 | 2,930 | 3,254 | 2,765 | 3,335 | 3,347 | 3,479 | 3,413 | 3,771 | 3,508 | 3,344 | 3,175 | 2,963 |
| 1997 | 3,019 | 3,302 | 3,360 | 3,331 | 3,829 | 3,802 | 3,329 | 3,229 | 3,531 | 3,130 | 2,872 | 3,054 |
| 1998 | 3,699 | 3,480 | 3,317 | 4,135 | 4,051 | 4,756 | 4,508 | 4,176 | 4,890 | 4,748 | 4,337 | 3,662 |
| 1999 | 4,550 | 4,244 | 4,132 | 4,309 | 4,373 | 4,209 | 3,871 | 3,352 | 3,494 | 3,646 | 3,767 | 3,955 |
| 2000 | 4,652 | 3,996 | 4,186 | 4,068 | 3,678 | 4,107 | 3,951 | 3,796 | 3,924 | 3,572 | 4,307 | 4,046 |
| 2001 | 4,804 | 4,980 | 6,203 | 5,518 | 5,931 | 5,555 | 4,728 | 5,119 | 4,790 | 4,740 | 4,533 | 4,122 |
| 2002 | 4,668 | 4,871 | 4,423 | 4,710 | 4,195 | 3,693 | 4,408 | 4,049 | 3,962 | 5,082 | 4,335 | 3,542 |
| 2003 | 4,286 | 4,164 | 3,847 | 3,889 | 3,795 | 3,958 | 4,175 | 4,491 | 4,249 | 4,289 | 3,620 | 3,407 |
| 2004 | 3,514 | 3,490 | 3,600 | 3,229 | 3,628 | 3,852 | 3,573 | 3,448 | 3,264 | 3,205 | 3,691 | 2,907 |
| 2005 | 2,818 | 3,626 | 3,901 | 2,928 | 3,017 | 3,109 | 2,882 | 2,801 | 3,003 | 3,495 | 3,492 | 3,409 |
| 2006 | 3,664 | 4,218 | 4,427 | 4,153 | 4,141 | 4,349 | 4,602 | 3,978 | 3,889 | 4,114 | 3,678 | 3,436 |
| 2007 | 4,059 | 4,759 | 5,155 | 5,029 | 4,851 | 4,332 | 4,495 | 4,214 | 4,582 | 3,950 | 3,821 | 3,737 |
| 2008 | 3,780 | 4,002 | 4,197 | 3,687 | 4,327 | 4,110 | 4,430 | 4,464 | 5,128 | 4,592 | 4,589 | 4,289 |
| 2009 | 4,724 | 4,578 | 4,595 | 4,855 | 4,592 | 4,778 | 4,584 | 4,350 | 3,849 | 4,344 | 4,188 | 3,678 |
| 2010 | 3,939 | 4,455 | 4,483 | 4,084 | 4,491 | 3,893 | 4,478 | 4,631 | 4,916 | 4,952 | 4,490 | 3,792 |
| 2011 | 4,542 | 4,544 | 4,344 | 4,746 | 4,375 | 4,727 | 4,361 | 4,933 | 4,015 | 4,482 | 4,393 | 3,778 |
| 2012 | 4,303 | 4,951 | 5,018 | 4,461 | 5,295 | 5,058 | 4,676 | 4,526 | 4,695 | 5,010 | 4,988 | 4,546 |
| 2013 | 5,075 | 4,035 | 4,568 | 4,910 | 4,351 | 4,875 | 4,386 | 4,091 | 4,331 | 4,419 | 4,189 | 3,894 |
| 2014 | 4,610 | 4,082 | 4,394 | 4,233 | 4,304 | 4,342 | 3,897 | 3,976 | 3,399 | 4,275 | 4,030 | 3,034 |
| 2015 | 3,351 | 3,424 | 3,343 | 3,644 | 3,647 | 3,429 | 3,300 | 3,566 | 3,921 | 3,511 | 3,493 | 3,339 |
| 2016 | 4,238 | 4,132 | 4,232 | 3,863 | 4,183 | 3,449 | 3,660 | 3,638 | 4,079 | 3,647 | 3,850 | 3,570 |
| 2017 | 3,838 | 3,601 | 3,482 | 4,031 | 3,876 | 3,736 | 4,021 | 4,434 | 3,935 | 4,017 | 3,538 | 3,588 |
| 2018 | 3,703 | 3,459 | 4,009 | 3,453 | 4,042 | 3,436 | 3,311 | 3,793 | 3,452 | 3,605 | 3,125 | 3,317 |
| 2019 | 3,334 | 4,135 | 3,798 | 3,788 | 3,595 | 3,579 | 3,601 | 3,543 | 3,658 | 3,915 | 3,534 | 3,534 |
| 2020 | 3,576 | 3,199 | 3,483 | 3,673 | 3,592 | 3,541 | 3,494 | 3,301 | 3,692 | 3,458 | 3,295 | 3,129 |
| 2021 | 3,434 | 3,902 | 4,019 | 3,550 | 3,972 | 3,769 | 3,498 | 3,585 | 3,615 | 3,925 | 3,785 | 3,497 |
| 2022 | 3,823 | 3,481 | 3,391 | 3,765 | 3,648 | 3,783 | 3,838 | 3,790 | 3,771 | 4,217 | 3,486 | 3,759 |
| 2023 | 3,933 | 3,821 | 4,024 | 3,968 | 4,195 | 4,082 | 3,774 | 3,834 | 4,294 | 4,239 | 4,342 | 4,749 |
| 2024 | 4,601 | |||||||||||
| - = No Data Reported; -- = Not Applicable; NA = Not Available; W = Withheld to avoid disclosure of individual company data. |
| Release Date: 3/29/2024 |
| Next Release Date: 4/30/2024 |