|
Download Data (XLS File) |
|
||||||||
|
||||||||
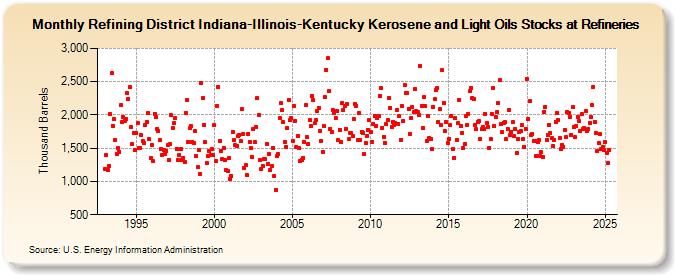
| Refining District Indiana-Illinois-Kentucky Kerosene and Light Oils Stocks at Refineries (Thousand Barrels) | ||||||||
| Year | Jan | Feb | Mar | Apr | May | Jun | Jul | Aug | Sep | Oct | Nov | Dec |
|---|---|---|---|---|---|---|---|---|---|---|---|---|
| 1993 | 1,191 | 1,396 | 1,168 | 1,235 | 2,011 | 2,626 | 1,840 | 1,937 | 1,621 | 1,419 | 1,502 | 1,449 |
| 1994 | 2,142 | 1,888 | 1,969 | 1,907 | 1,940 | 2,327 | 2,236 | 2,413 | 1,817 | 1,557 | 1,731 | 1,470 |
| 1995 | 1,726 | 1,873 | 1,505 | 1,505 | 1,695 | 1,605 | 1,582 | 1,845 | 1,894 | 2,027 | 1,632 | 1,352 |
| 1996 | 1,555 | 1,301 | 2,021 | 1,974 | 1,789 | 1,762 | 1,622 | 1,486 | 1,405 | 1,466 | 1,414 | 1,463 |
| 1997 | 1,546 | 1,321 | 1,566 | 1,994 | 1,796 | 1,877 | 1,951 | 1,490 | 1,325 | 1,393 | 1,487 | 1,325 |
| 1998 | 1,355 | 1,289 | 2,029 | 2,227 | 1,596 | 1,806 | 1,833 | 1,598 | 1,571 | 1,752 | 1,376 | 1,216 |
| 1999 | 1,473 | 1,113 | 2,486 | 2,252 | 1,856 | 1,586 | 1,270 | 1,385 | 1,456 | 1,392 | 1,487 | 1,393 |
| 2000 | 1,842 | 1,304 | 2,135 | 2,418 | 1,601 | 1,463 | 1,330 | 1,509 | 1,320 | 1,173 | 1,151 | 1,349 |
| 2001 | 1,042 | 1,085 | 1,742 | 1,624 | 1,545 | 1,539 | 1,689 | 1,705 | 1,601 | 2,082 | 1,715 | 1,209 |
| 2002 | 1,247 | 1,096 | 1,720 | 1,599 | 1,502 | 1,363 | 1,787 | 1,589 | 1,825 | 2,250 | 2,006 | 1,321 |
| 2003 | 1,189 | 1,233 | 1,338 | 1,333 | 1,562 | 1,260 | 1,420 | 1,173 | 1,230 | 1,510 | 1,087 | 870 |
| 2004 | 1,382 | 1,413 | 1,947 | 2,177 | 2,071 | 1,890 | 1,587 | 1,524 | 1,798 | 2,230 | 1,928 | 1,953 |
| 2005 | 1,614 | 2,132 | 1,910 | 1,524 | 1,689 | 1,498 | 1,314 | 1,325 | 1,357 | 1,594 | 2,149 | 1,664 |
| 2006 | 1,564 | 1,924 | 1,826 | 2,281 | 2,220 | 1,872 | 1,924 | 2,052 | 2,111 | 1,759 | 1,606 | 1,450 |
| 2007 | 1,829 | 2,269 | 2,679 | 2,850 | 2,355 | 1,793 | 1,737 | 2,070 | 2,033 | 1,960 | 2,062 | 1,617 |
| 2008 | 1,778 | 1,586 | 2,172 | 2,079 | 2,133 | 1,794 | 2,159 | 1,631 | 1,733 | 1,724 | 1,689 | 1,942 |
| 2009 | 2,164 | 2,138 | 1,620 | 2,033 | 1,630 | 1,750 | 1,723 | 1,414 | 1,581 | 1,684 | 1,777 | 1,921 |
| 2010 | 1,737 | 1,595 | 1,869 | 1,985 | 1,839 | 1,947 | 1,985 | 2,289 | 2,401 | 1,809 | 1,674 | 1,579 |
| 2011 | 1,858 | 1,924 | 2,249 | 2,110 | 1,819 | 1,898 | 1,844 | 1,884 | 2,071 | 1,868 | 1,981 | 1,628 |
| 2012 | 2,134 | 1,913 | 2,444 | 2,334 | 2,334 | 2,096 | 1,715 | 1,957 | 2,114 | 2,041 | 2,387 | 2,062 |
| 2013 | 2,039 | 1,995 | 2,735 | 2,131 | 1,805 | 2,265 | 2,131 | 1,606 | 1,977 | 1,653 | 1,644 | 1,485 |
| 2014 | 2,120 | 2,235 | 2,374 | 2,406 | 1,894 | 2,085 | 1,847 | 2,671 | 2,177 | 1,763 | 1,897 | 1,580 |
| 2015 | 1,641 | 1,841 | 1,983 | 1,485 | 1,357 | 1,958 | 1,626 | 1,874 | 2,223 | 1,829 | 1,729 | 1,501 |
| 2016 | 1,557 | 1,983 | 1,841 | 2,017 | 2,358 | 2,405 | 2,256 | 2,242 | 1,846 | 1,781 | 1,895 | 1,908 |
| 2017 | 1,636 | 1,788 | 1,816 | 1,793 | 2,021 | 1,877 | 1,816 | 1,504 | 1,640 | 2,018 | 2,405 | 1,832 |
| 2018 | 1,965 | 2,044 | 2,176 | 2,520 | 1,863 | 1,738 | 1,885 | 1,890 | 1,631 | 1,789 | 2,076 | 1,695 |
| 2019 | 1,750 | 1,888 | 1,682 | 1,789 | 1,429 | 1,635 | 1,747 | 1,752 | 1,842 | 1,633 | 1,516 | 1,789 |
| 2020 | 2,541 | 1,939 | 2,203 | 1,693 | 1,716 | 1,615 | 1,608 | 1,388 | 1,590 | 1,624 | 1,390 | 1,438 |
| 2021 | 1,373 | 2,047 | 2,121 | 1,628 | 1,696 | 1,853 | 1,727 | 1,649 | 1,531 | 1,630 | 1,900 | 2,030 |
| 2022 | 1,921 | 1,652 | 1,482 | 1,546 | 1,519 | 1,778 | 1,668 | 2,037 | 2,031 | 1,973 | 1,705 | 2,117 |
| 2023 | 1,821 | 1,664 | 1,840 | 1,973 | 1,902 | 1,761 | 2,007 | 1,792 | 1,804 | 2,056 | 1,753 | 1,788 |
| 2024 | 1,885 | |||||||||||
| - = No Data Reported; -- = Not Applicable; NA = Not Available; W = Withheld to avoid disclosure of individual company data. |
| Release Date: 3/29/2024 |
| Next Release Date: 4/30/2024 |