|
Download Data (XLS File) |
|
||||||||
|
||||||||
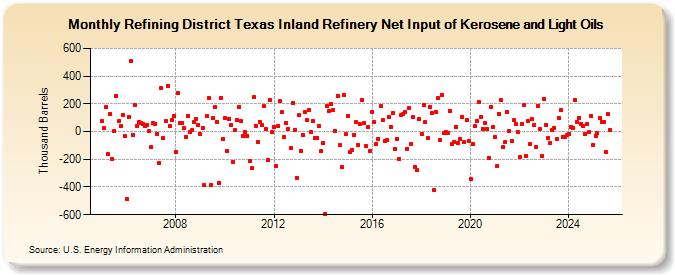
| Refining District Texas Inland Refinery Net Input of Kerosene and Light Oils (Thousand Barrels) | ||||||||
| Year | Jan | Feb | Mar | Apr | May | Jun | Jul | Aug | Sep | Oct | Nov | Dec |
|---|---|---|---|---|---|---|---|---|---|---|---|---|
| 2005 | 76 | 25 | 176 | -162 | 125 | -201 | 4 | 259 | 73 | 41 | 121 | -34 |
| 2006 | -485 | 104 | 510 | -22 | 194 | 41 | 66 | 64 | 56 | 42 | 47 | 2 |
| 2007 | -108 | 60 | 58 | -17 | -230 | 312 | -46 | 77 | 331 | 38 | 85 | 112 |
| 2008 | -145 | 279 | 60 | 65 | 25 | -37 | 112 | -5 | 12 | 66 | 93 | 49 |
| 2009 | -18 | 26 | -384 | 109 | 241 | -387 | 95 | 178 | 72 | -370 | 244 | -51 |
| 2010 | 98 | -138 | 89 | 45 | -218 | 10 | 84 | 179 | 74 | -35 | -4 | -31 |
| 2011 | -211 | -265 | 246 | 43 | -74 | 69 | 48 | 181 | 17 | -206 | 227 | -6 |
| 2012 | 35 | -247 | 39 | 218 | 140 | -42 | 60 | 19 | -120 | 203 | 14 | -333 |
| 2013 | 118 | -140 | -25 | 143 | 84 | 158 | -2 | 76 | -44 | -49 | 41 | -141 |
| 2014 | -84 | -593 | 185 | 145 | 198 | 156 | 2 | 255 | -98 | -254 | 265 | -21 |
| 2015 | 114 | -151 | -132 | -22 | 67 | -97 | 54 | 227 | 61 | -103 | 33 | -142 |
| 2016 | 142 | 68 | -90 | -52 | 183 | 82 | -71 | -58 | 102 | 35 | 133 | -124 |
| 2017 | -53 | -197 | 119 | 128 | 138 | -125 | 171 | -88 | 107 | -255 | -280 | 90 |
| 2018 | -16 | 193 | 66 | -46 | 177 | 136 | -425 | 143 | 241 | -61 | 267 | -12 |
| 2019 | -6 | -7 | 149 | -92 | -76 | 35 | -79 | -52 | 104 | -74 | 81 | -68 |
| 2020 | -345 | -90 | 39 | 75 | 212 | 106 | 22 | 60 | 20 | -188 | 175 | 34 |
| 2021 | -42 | -248 | 126 | 227 | -112 | -77 | 142 | 3 | -67 | 80 | 57 | -1 |
| 2022 | -182 | 55 | 189 | -176 | 77 | -91 | 90 | 44 | -113 | 187 | 15 | -177 |
| 2023 | 234 | 49 | -52 | -81 | 12 | 24 | -55 | 101 | 153 | -37 | -42 | -27 |
| 2024 | -21 | |||||||||||
| - = No Data Reported; -- = Not Applicable; NA = Not Available; W = Withheld to avoid disclosure of individual company data. |
| Release Date: 3/29/2024 |
| Next Release Date: 4/30/2024 |