|
Download Data (XLS File) |
|
||||||||
|
||||||||
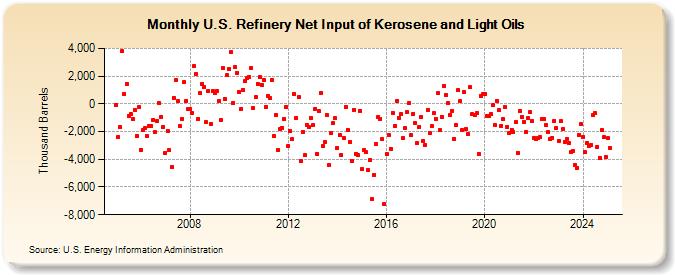
| U.S. Refinery Net Input of Kerosene and Light Oils (Thousand Barrels) | ||||||||
| Year | Jan | Feb | Mar | Apr | May | Jun | Jul | Aug | Sep | Oct | Nov | Dec |
|---|---|---|---|---|---|---|---|---|---|---|---|---|
| 2005 | -90 | -2,381 | -1,700 | 3,807 | 740 | 1,458 | -889 | -731 | -1,084 | -417 | -2,309 | -264 |
| 2006 | -3,312 | -1,893 | -1,762 | -2,347 | -1,583 | -1,574 | -1,161 | -2,065 | -1,235 | 40 | -943 | -1,662 |
| 2007 | -3,516 | -1,953 | -3,358 | -4,550 | 445 | 1,703 | 182 | -1,606 | -1,065 | 1,541 | 216 | -352 |
| 2008 | -369 | -628 | 2,740 | 2,120 | -1,071 | 755 | 1,436 | 1,200 | -1,333 | 935 | -1,439 | 904 |
| 2009 | 762 | 912 | 173 | -1,146 | 2,560 | 369 | 2,047 | 2,502 | 3,762 | 54 | 2,649 | 2,260 |
| 2010 | 852 | -364 | 1,018 | 1,627 | 1,867 | 1,913 | 2,620 | -310 | 460 | 1,456 | 1,953 | 1,388 |
| 2011 | 1,750 | -210 | 590 | 422 | 1,703 | -2,325 | -799 | -3,299 | -1,816 | -1,708 | -1,090 | -225 |
| 2012 | -3,013 | -1,967 | -2,549 | 680 | -1,015 | 463 | -4,094 | -2,049 | -3,720 | -1,497 | -1,656 | -1,019 |
| 2013 | -1,548 | -342 | -3,586 | -550 | 751 | -3,057 | -2,773 | -818 | -4,439 | -2,105 | -1,386 | -1,046 |
| 2014 | -3,195 | -2,247 | -3,709 | -2,450 | -193 | -1,868 | -2,738 | -4,129 | -413 | -3,591 | -3,715 | -498 |
| 2015 | -4,709 | -3,362 | -3,511 | -4,762 | -4,024 | -6,892 | -5,124 | -2,895 | -949 | -1,094 | -2,567 | -7,228 |
| 2016 | -3,639 | -2,247 | -3,233 | -656 | -1,593 | 215 | -995 | -765 | -2,485 | -1,738 | -578 | 30 |
| 2017 | -2,273 | -707 | -1,393 | -2,837 | -1,646 | -940 | -2,702 | -2,985 | -421 | -2,133 | -1,613 | -684 |
| 2018 | -1,063 | 751 | -1,881 | -932 | 1,307 | 654 | 58 | -774 | -484 | -2,508 | -1,531 | 962 |
| 2019 | 182 | -1,893 | 831 | -1,833 | -2,167 | 1,192 | -748 | -786 | -686 | -3,614 | 590 | 684 |
| 2020 | 675 | -870 | -874 | -754 | -103 | -1,531 | 228 | -475 | -1,568 | -1,101 | -235 | -1,644 |
| 2021 | -2,081 | -1,861 | -2,032 | -1,330 | -3,529 | -532 | -927 | -1,275 | -2,036 | -1,038 | -606 | -1,230 |
| 2022 | -2,447 | -2,508 | -2,466 | -2,387 | -1,073 | -1,126 | -1,511 | -2,066 | -2,549 | -2,432 | -1,226 | -1,744 |
| 2023 | -2,622 | -1,326 | -1,784 | -2,471 | -2,077 | -2,447 | -3,077 | -2,960 | -4,019 | -4,267 | -1,828 | -1,466 |
| 2024 | -2,382 | |||||||||||
| - = No Data Reported; -- = Not Applicable; NA = Not Available; W = Withheld to avoid disclosure of individual company data. |
| Release Date: 3/29/2024 |
| Next Release Date: 4/30/2024 |