|
Download Data (XLS File) |
|
||||||||
|
||||||||
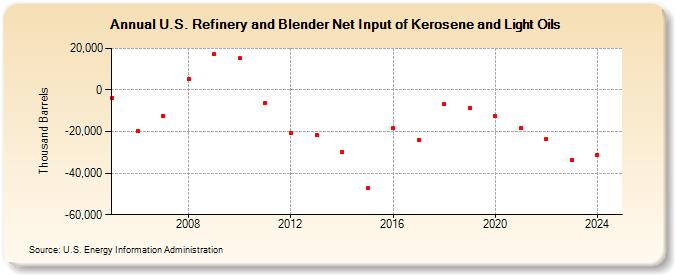
| U.S. Refinery and Blender Net Input of Kerosene and Light Oils (Thousand Barrels) | ||||||||
| Decade | Year-0 | Year-1 | Year-2 | Year-3 | Year-4 | Year-5 | Year-6 | Year-7 | Year-8 | Year-9 |
|---|---|---|---|---|---|---|---|---|---|---|
| 2000's | -3,860 | -19,497 | -12,313 | 5,250 | 17,143 | |||||
| 2010's | 15,173 | -6,239 | -20,914 | -21,425 | -29,608 | -47,299 | -18,421 | -23,990 | -6,852 | -8,612 |
| 2020's | -12,728 | -18,390 | -23,358 | -30,344 |
| - = No Data Reported; -- = Not Applicable; NA = Not Available; W = Withheld to avoid disclosure of individual company data. |
| Release Date: 3/29/2024 |
| Next Release Date: 8/30/2024 |