|
Download Data (XLS File) |
|
||||||||
|
||||||||
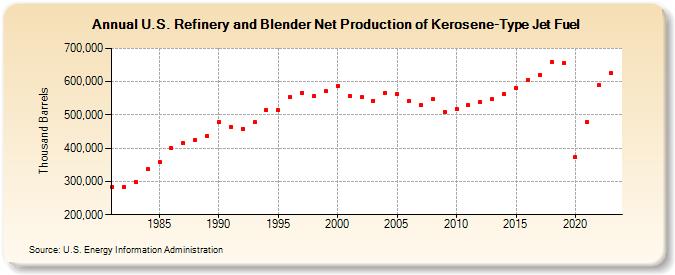
| U.S. Refinery and Blender Net Production of Kerosene-Type Jet Fuel (Thousand Barrels) | ||||||||
| Decade | Year-0 | Year-1 | Year-2 | Year-3 | Year-4 | Year-5 | Year-6 | Year-7 | Year-8 | Year-9 |
|---|---|---|---|---|---|---|---|---|---|---|
| 1980's | 282,787 | 283,799 | 298,175 | 336,521 | 358,753 | 400,433 | 415,470 | 425,930 | 436,817 | |
| 1990's | 478,380 | 465,136 | 458,955 | 477,861 | 514,577 | 513,661 | 553,729 | 567,054 | 556,664 | 571,074 |
| 2000's | 587,899 | 558,230 | 552,511 | 543,345 | 566,164 | 564,226 | 540,556 | 528,476 | 546,410 | 509,684 |
| 2010's | 517,475 | 528,811 | 538,319 | 547,275 | 562,600 | 580,431 | 603,899 | 621,176 | 659,333 | 655,718 |
| 2020's | 372,645 | 478,472 | 589,578 | 624,878 |
| - = No Data Reported; -- = Not Applicable; NA = Not Available; W = Withheld to avoid disclosure of individual company data. |
| Release Date: 3/29/2024 |
| Next Release Date: 8/30/2024 |