|
Download Data (XLS File) |
|
||||||||
|
||||||||
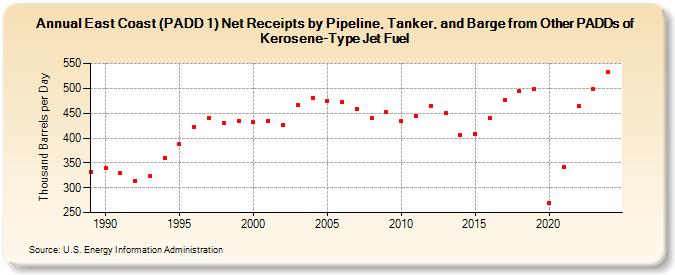
| East Coast (PADD 1) Net Receipts by Pipeline, Tanker, and Barge from Other PADDs of Kerosene-Type Jet Fuel (Thousand Barrels per Day) | ||||||||
| Decade | Year-0 | Year-1 | Year-2 | Year-3 | Year-4 | Year-5 | Year-6 | Year-7 | Year-8 | Year-9 |
|---|---|---|---|---|---|---|---|---|---|---|
| 1980's | 332 | |||||||||
| 1990's | 340 | 329 | 314 | 324 | 360 | 388 | 422 | 441 | 431 | 434 |
| 2000's | 432 | 435 | 427 | 467 | 481 | 475 | 472 | 459 | 440 | 452 |
| 2010's | 434 | 445 | 465 | 450 | 406 | 409 | 441 | 476 | 495 | 499 |
| 2020's | 270 | 341 | 464 | 500 |
| - = No Data Reported; -- = Not Applicable; NA = Not Available; W = Withheld to avoid disclosure of individual company data. |
| Release Date: 3/29/2024 |
| Next Release Date: 8/30/2024 |