|
Download Data (XLS File) |
|
||||||||
|
||||||||
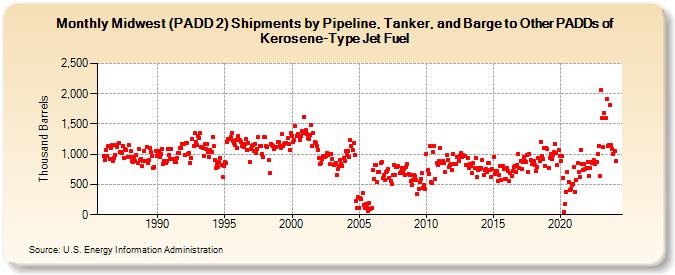
| Midwest (PADD 2) Shipments by Pipeline, Tanker, and Barge to Other PADDs of Kerosene-Type Jet Fuel (Thousand Barrels) | ||||||||
| Year | Jan | Feb | Mar | Apr | May | Jun | Jul | Aug | Sep | Oct | Nov | Dec |
|---|---|---|---|---|---|---|---|---|---|---|---|---|
| 1986 | 974 | 909 | 1,067 | 976 | 1,137 | 921 | 1,095 | 1,150 | 885 | 932 | 984 | 1,158 |
| 1987 | 1,127 | 1,178 | 1,029 | 1,035 | 1,016 | 1,141 | 940 | 1,080 | 1,062 | 960 | 1,151 | 959 |
| 1988 | 1,045 | 880 | 879 | 961 | 886 | 991 | 852 | 1,088 | 904 | 927 | 806 | 886 |
| 1989 | 1,049 | 896 | 1,124 | 853 | 907 | 1,105 | 1,037 | 963 | 771 | 797 | 1,059 | 975 |
| 1990 | 995 | 1,047 | 951 | 1,005 | 1,092 | 839 | 881 | 850 | 892 | 1,085 | 986 | 926 |
| 1991 | 1,092 | 924 | 927 | 866 | 873 | 936 | 1,013 | 1,013 | 1,109 | 1,099 | 1,174 | 1,166 |
| 1992 | 987 | 1,190 | 1,191 | 1,011 | 1,016 | 863 | 944 | 1,257 | 1,133 | 1,346 | 1,197 | 1,148 |
| 1993 | 1,307 | 1,260 | 1,349 | 1,123 | 1,111 | 964 | 1,164 | 1,080 | 1,169 | 1,039 | 951 | 1,065 |
| 1994 | 1,043 | 1,292 | 1,129 | 902 | 767 | 835 | 793 | 865 | 941 | 824 | 622 | 802 |
| 1995 | 864 | 855 | 1,195 | 1,248 | 1,245 | 1,290 | 1,355 | 1,224 | 1,188 | 1,160 | 1,238 | 1,096 |
| 1996 | 1,299 | 1,236 | 1,210 | 1,131 | 1,143 | 1,120 | 1,175 | 1,249 | 1,067 | 1,191 | 878 | 1,089 |
| 1997 | 1,144 | 1,145 | 1,047 | 1,172 | 1,027 | 1,086 | 1,278 | 1,137 | 1,138 | 997 | 956 | 1,280 |
| 1998 | 1,278 | 1,133 | 1,122 | 904 | 685 | 1,176 | 1,159 | 1,130 | 1,090 | 1,116 | 1,123 | 1,202 |
| 1999 | 1,194 | 1,131 | 1,110 | 1,327 | 1,138 | 1,161 | 1,178 | 1,190 | 1,271 | 1,161 | 1,067 | 1,359 |
| 2000 | 1,307 | 1,194 | 1,230 | 1,474 | 1,308 | 1,332 | 1,301 | 1,243 | 1,303 | 1,377 | 1,349 | 1,622 |
| 2001 | 1,400 | 1,341 | 1,260 | 1,258 | 1,313 | 1,491 | 1,137 | 1,349 | 1,197 | 1,188 | 1,133 | 1,076 |
| 2002 | 935 | 831 | 861 | 924 | 978 | 955 | 973 | 1,028 | 995 | 1,000 | 834 | 1,006 |
| 2003 | 916 | 826 | 844 | 854 | 658 | 758 | 810 | 907 | 831 | 812 | 940 | 886 |
| 2004 | 1,058 | 981 | 1,055 | 957 | 1,233 | 1,143 | 1,074 | 1,182 | 984 | 225 | 117 | 286 |
| 2005 | 114 | 269 | 261 | 367 | 167 | 112 | 180 | 123 | 64 | 189 | 90 | 110 |
| 2006 | 737 | 594 | 818 | 820 | 540 | 699 | 713 | 853 | 874 | 599 | 649 | 579 |
| 2007 | 710 | 720 | 752 | 608 | 561 | 502 | 650 | 825 | 663 | 783 | 793 | 807 |
| 2008 | 682 | 704 | 768 | 688 | 761 | 664 | 793 | 834 | 681 | 658 | 551 | 493 |
| 2009 | 580 | 663 | 648 | 566 | 336 | 423 | 538 | 598 | 685 | 438 | 484 | 429 |
| 2010 | 1,011 | 735 | 677 | 1,130 | 536 | 518 | 1,035 | 1,144 | 590 | 853 | 826 | 892 |
| 2011 | 1,102 | 875 | 847 | 895 | 862 | 708 | 994 | 908 | 786 | 820 | 834 | 744 |
| 2012 | 1,008 | 840 | 831 | 947 | 962 | 895 | 966 | 1,028 | 947 | 985 | 972 | 822 |
| 2013 | 814 | 930 | 773 | 842 | 807 | 684 | 853 | 780 | 940 | 616 | 740 | 777 |
| 2014 | 748 | 778 | 899 | 657 | 740 | 763 | 713 | 859 | 852 | 747 | 630 | 754 |
| 2015 | 960 | 674 | 728 | 720 | 561 | 654 | 812 | 569 | 811 | 760 | 587 | 594 |
| 2016 | 765 | 717 | 556 | 695 | 634 | 722 | 784 | 808 | 714 | 818 | 1,006 | 770 |
| 2017 | 889 | 757 | 878 | 952 | 881 | 879 | 988 | 708 | 1,009 | 897 | 834 | 893 |
| 2018 | 881 | 816 | 729 | 786 | 943 | 881 | 1,207 | 972 | 914 | 1,103 | 812 | 1,101 |
| 2019 | 1,081 | 772 | 940 | 1,004 | 923 | 986 | 1,030 | 1,173 | 1,025 | 815 | 1,069 | 966 |
| 2020 | 894 | 969 | 609 | 47 | 183 | 383 | 709 | 549 | 408 | 422 | 498 | 514 |
| 2021 | 784 | 383 | 576 | 848 | 706 | 630 | 1,070 | 844 | 745 | 832 | 755 | 774 |
| 2022 | 873 | 644 | 779 | 864 | 848 | 872 | 900 | 840 | 868 | 999 | 1,133 | 637 |
| 2023 | 2,069 | 1,601 | 1,116 | 1,687 | 1,591 | 1,915 | 1,137 | 1,153 | 1,813 | 1,155 | 1,087 | 1,005 |
| 2024 | 1,045 | |||||||||||
| - = No Data Reported; -- = Not Applicable; NA = Not Available; W = Withheld to avoid disclosure of individual company data. |
| Release Date: 3/29/2024 |
| Next Release Date: 4/30/2024 |