|
Download Data (XLS File) |
|
||||||||
|
||||||||
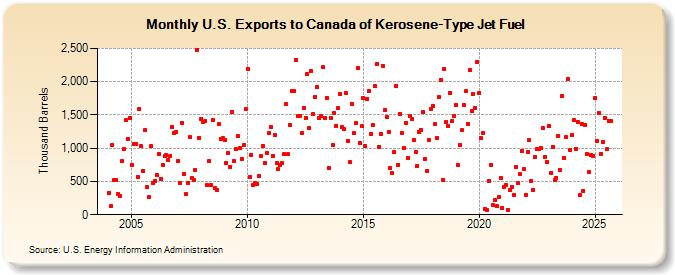
| U.S. Exports to Canada of Kerosene-Type Jet Fuel (Thousand Barrels) | ||||||||
| Year | Jan | Feb | Mar | Apr | May | Jun | Jul | Aug | Sep | Oct | Nov | Dec |
|---|---|---|---|---|---|---|---|---|---|---|---|---|
| 2004 | 332 | 125 | 1,052 | 518 | 528 | 308 | 276 | 800 | 982 | 1,421 | 1,138 | 1,451 |
| 2005 | 753 | 1,069 | 1,059 | 571 | 1,587 | 1,028 | 651 | 1,269 | 413 | 260 | 1,032 | 470 |
| 2006 | 509 | 600 | 913 | 541 | 748 | 880 | 895 | 824 | 888 | 1,321 | 1,235 | 1,248 |
| 2007 | 804 | 472 | 1,384 | 618 | 309 | 481 | 1,171 | 549 | 517 | 671 | 2,480 | 1,157 |
| 2008 | 1,446 | 1,392 | 1,404 | 440 | 804 | 446 | 1,418 | 396 | 365 | 1,368 | 1,145 | 1,146 |
| 2009 | 1,122 | 778 | 924 | 724 | 1,549 | 801 | 987 | 1,182 | 997 | 840 | 1,051 | 1,590 |
| 2010 | 2,196 | 570 | 905 | 447 | 474 | 469 | 587 | 883 | 1,030 | 775 | 933 | 1,232 |
| 2011 | 1,324 | 877 | 1,200 | 784 | 680 | 749 | 774 | 911 | 1,665 | 908 | 1,356 | 1,862 |
| 2012 | 1,856 | 2,328 | 1,482 | 1,488 | 1,228 | 1,602 | 1,461 | 2,117 | 1,297 | 2,158 | 1,519 | 1,772 |
| 2013 | 1,916 | 1,448 | 1,484 | 2,216 | 1,461 | 1,761 | 706 | 1,458 | 1,045 | 1,532 | 1,338 | 1,600 |
| 2014 | 1,814 | 1,311 | 1,288 | 1,827 | 1,114 | 785 | 1,668 | 1,224 | 1,378 | 2,202 | 1,085 | 1,332 |
| 2015 | 1,756 | 1,039 | 1,742 | 1,853 | 1,219 | 1,343 | 1,928 | 2,271 | 1,025 | 1,218 | 2,240 | 1,573 |
| 2016 | 1,462 | 1,241 | 699 | 623 | 942 | 1,937 | 749 | 1,511 | 1,230 | 1,007 | 1,385 | 859 |
| 2017 | 1,477 | 1,441 | 1,129 | 944 | 733 | 1,238 | 1,268 | 1,537 | 844 | 664 | 1,116 | 1,595 |
| 2018 | 1,637 | 1,357 | 1,155 | 1,767 | 2,029 | 527 | 2,196 | 1,400 | 1,330 | 1,836 | 1,407 | 1,486 |
| 2019 | 1,651 | 750 | 1,052 | 1,267 | 1,656 | 1,854 | 1,363 | 2,175 | 1,558 | 1,815 | 1,602 | 2,296 |
| 2020 | 1,832 | 1,148 | 1,223 | 93 | 71 | 510 | 751 | 153 | 219 | 126 | 261 | 550 |
| 2021 | 107 | 413 | 450 | 74 | 375 | 416 | 293 | 722 | 477 | 605 | 957 | 686 |
| 2022 | 301 | 945 | 1,116 | 505 | 374 | 875 | 985 | 991 | 1,010 | 1,297 | 870 | 791 |
| 2023 | 1,332 | 625 | 1,012 | 520 | 558 | 1,106 | 676 | 1,836 | 856 | 1,169 | 2,035 | 978 |
| 2024 | 1,194 | |||||||||||
| - = No Data Reported; -- = Not Applicable; NA = Not Available; W = Withheld to avoid disclosure of individual company data. |
| Release Date: 3/29/2024 |
| Next Release Date: 4/30/2024 |