|
Download Data (XLS File) |
|
||||||||
|
||||||||
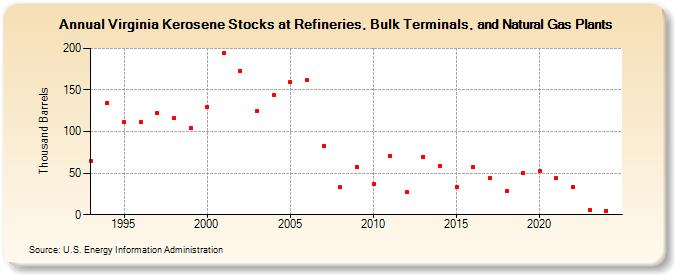
| Virginia Kerosene Stocks at Refineries, Bulk Terminals, and Natural Gas Plants (Thousand Barrels) | ||||||||
| Decade | Year-0 | Year-1 | Year-2 | Year-3 | Year-4 | Year-5 | Year-6 | Year-7 | Year-8 | Year-9 |
|---|---|---|---|---|---|---|---|---|---|---|
| 1990's | 65 | 134 | 111 | 111 | 122 | 116 | 104 | |||
| 2000's | 129 | 195 | 173 | 125 | 144 | 159 | 162 | 83 | 33 | 57 |
| 2010's | 37 | 71 | 27 | 70 | 58 | 33 | 57 | 44 | 29 | 50 |
| 2020's | 52 | 44 | 33 | 6 |
| - = No Data Reported; -- = Not Applicable; NA = Not Available; W = Withheld to avoid disclosure of individual company data. |
| Release Date: 3/29/2024 |
| Next Release Date: 8/30/2024 |