|
Download Data (XLS File) |
|
||||||||
|
||||||||
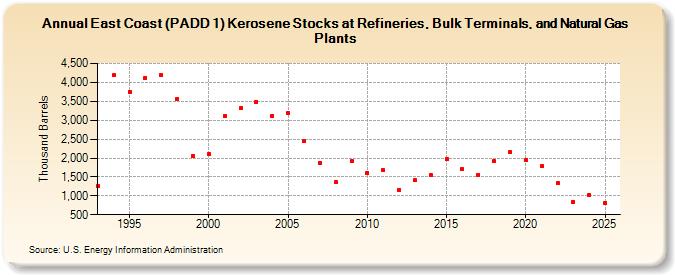
| East Coast (PADD 1) Kerosene Stocks at Refineries, Bulk Terminals, and Natural Gas Plants (Thousand Barrels) | ||||||||
| Decade | Year-0 | Year-1 | Year-2 | Year-3 | Year-4 | Year-5 | Year-6 | Year-7 | Year-8 | Year-9 |
|---|---|---|---|---|---|---|---|---|---|---|
| 1990's | 1,265 | 4,183 | 3,748 | 4,119 | 4,193 | 3,564 | 2,065 | |||
| 2000's | 2,112 | 3,107 | 3,313 | 3,482 | 3,113 | 3,184 | 2,442 | 1,865 | 1,359 | 1,916 |
| 2010's | 1,605 | 1,678 | 1,158 | 1,408 | 1,543 | 1,962 | 1,709 | 1,561 | 1,922 | 2,156 |
| 2020's | 1,940 | 1,782 | 1,328 | 837 |
| - = No Data Reported; -- = Not Applicable; NA = Not Available; W = Withheld to avoid disclosure of individual company data. |
| Release Date: 3/29/2024 |
| Next Release Date: 8/30/2024 |