|
Download Data (XLS File) |
|
||||||||
|
||||||||
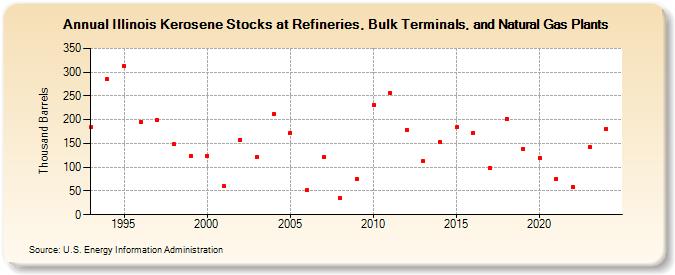
| Illinois Kerosene Stocks at Refineries, Bulk Terminals, and Natural Gas Plants (Thousand Barrels) | ||||||||
| Decade | Year-0 | Year-1 | Year-2 | Year-3 | Year-4 | Year-5 | Year-6 | Year-7 | Year-8 | Year-9 |
|---|---|---|---|---|---|---|---|---|---|---|
| 1990's | 184 | 285 | 313 | 196 | 199 | 148 | 123 | |||
| 2000's | 124 | 60 | 158 | 121 | 212 | 173 | 51 | 121 | 36 | 76 |
| 2010's | 231 | 257 | 179 | 112 | 152 | 184 | 172 | 98 | 202 | 139 |
| 2020's | 120 | 76 | 58 | 143 |
| - = No Data Reported; -- = Not Applicable; NA = Not Available; W = Withheld to avoid disclosure of individual company data. |
| Release Date: 3/29/2024 |
| Next Release Date: 8/30/2024 |