|
Download Data (XLS File) |
|
||||||||
|
||||||||
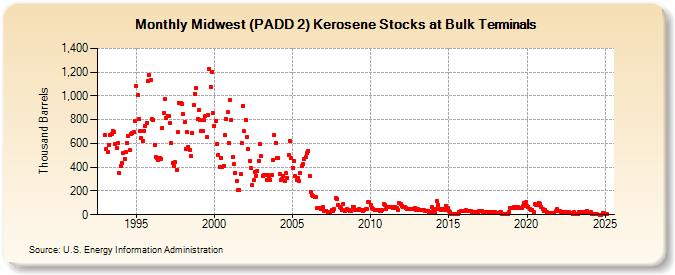
| Midwest (PADD 2) Kerosene Stocks at Bulk Terminals (Thousand Barrels) | ||||||||
| Year | Jan | Feb | Mar | Apr | May | Jun | Jul | Aug | Sep | Oct | Nov | Dec |
|---|---|---|---|---|---|---|---|---|---|---|---|---|
| 1993 | 669 | 554 | 531 | 586 | 668 | 678 | 703 | 695 | 599 | 559 | 602 | 349 |
| 1994 | 411 | 433 | 519 | 471 | 525 | 606 | 664 | 546 | 678 | 687 | 696 | 790 |
| 1995 | 1,083 | 1,008 | 802 | 706 | 649 | 619 | 708 | 744 | 775 | 1,127 | 1,172 | 1,135 |
| 1996 | 808 | 799 | 591 | 488 | 476 | 464 | 477 | 468 | 733 | 852 | 971 | 814 |
| 1997 | 831 | 829 | 771 | 602 | 437 | 406 | 440 | 377 | 693 | 943 | 944 | 930 |
| 1998 | 849 | 777 | 554 | 695 | 574 | 545 | 491 | 686 | 920 | 1,018 | 1,066 | 804 |
| 1999 | 885 | 797 | 705 | 701 | 794 | 829 | 654 | 843 | 1,228 | 1,077 | 1,205 | 855 |
| 2000 | 748 | 789 | 597 | 504 | 405 | 479 | 404 | 410 | 668 | 808 | 861 | 606 |
| 2001 | 968 | 797 | 482 | 423 | 354 | 283 | 208 | 208 | 339 | 603 | 918 | 702 |
| 2002 | 800 | 657 | 551 | 453 | 397 | 246 | 289 | 363 | 329 | 368 | 453 | 595 |
| 2003 | 493 | 330 | 337 | 335 | 296 | 331 | 322 | 295 | 332 | 459 | 675 | 604 |
| 2004 | 480 | 479 | 343 | 293 | 302 | 324 | 287 | 349 | 312 | 500 | 618 | 481 |
| 2005 | 394 | 450 | 325 | 294 | 310 | 282 | 350 | 407 | 425 | 467 | 487 | 517 |
| 2006 | 537 | 328 | 191 | 164 | 154 | 151 | 148 | 60 | 59 | 53 | 46 | 64 |
| 2007 | 34 | 30 | 32 | 22 | 25 | 13 | 42 | 34 | 44 | 139 | 131 | 81 |
| 2008 | 61 | 55 | 42 | 93 | 31 | 37 | 45 | 40 | 34 | 34 | 69 | 67 |
| 2009 | 43 | 41 | 42 | 44 | 39 | 38 | 32 | 42 | 45 | 50 | 111 | 107 |
| 2010 | 78 | 56 | 48 | 43 | 43 | 41 | 37 | 33 | 31 | 37 | 90 | 78 |
| 2011 | 50 | 63 | 67 | 64 | 62 | 60 | 57 | 64 | 54 | 36 | 100 | 88 |
| 2012 | 72 | 65 | 63 | 57 | 51 | 50 | 47 | 45 | 48 | 47 | 55 | 43 |
| 2013 | 46 | 42 | 43 | 38 | 37 | 36 | 35 | 33 | 35 | 21 | 22 | 61 |
| 2014 | 34 | 16 | 50 | 113 | 82 | 44 | 42 | 49 | 46 | 41 | 72 | 59 |
| 2015 | 35 | 22 | 8 | 8 | 8 | 8 | 7 | 6 | 27 | 29 | 28 | 29 |
| 2016 | 31 | 36 | 34 | 34 | 30 | 29 | 27 | 26 | 27 | 27 | 25 | 29 |
| 2017 | 32 | 28 | 26 | 25 | 24 | 23 | 22 | 22 | 22 | 25 | 25 | 24 |
| 2018 | 18 | 18 | 17 | 20 | 20 | 9 | 7 | 6 | 4 | 9 | 26 | 55 |
| 2019 | 60 | 57 | 62 | 58 | 69 | 64 | 60 | 59 | 53 | 70 | 99 | 103 |
| 2020 | 70 | 69 | 51 | 41 | 41 | 22 | 86 | 84 | 83 | 98 | 90 | 66 |
| 2021 | 46 | 29 | 41 | 19 | 18 | 17 | 17 | 16 | 16 | 16 | 29 | 44 |
| 2022 | 35 | 29 | 25 | 25 | 24 | 24 | 23 | 22 | 20 | 13 | 11 | 4 |
| 2023 | 20 | 3 | 5 | 4 | 25 | 25 | 24 | 23 | 23 | 21 | 35 | 18 |
| 2024 | 16 | |||||||||||
| - = No Data Reported; -- = Not Applicable; NA = Not Available; W = Withheld to avoid disclosure of individual company data. |
| Release Date: 3/29/2024 |
| Next Release Date: 4/30/2024 |